


Australia’s Q2 GDP growth came in stronger than expected, giving the Reserve Bank of Australia (RBA) further reason to keep interest rates on hold until at least Q4. Household spending was notably firmer than anticipated, helping GDP accelerate to a seven-quarter high of 1.8% y/y (0.6% q/q). Combined with the upside surprise in the latest inflation gauge — not just a result of spiking electricity prices — the RBA has more justification to remain cautious on the policy outlook.
View related analysis:
- USD/JPY, AUD/USD Outlook: Volatility Within Range as US Dollar Rallies
- US Jobs Outlook: Payroll Declines, Rising Wages Test USD, Fed Policy
- Australian CPI Data Supports RBA’s Cautious Approach on Rate Cuts

Chart prepared by Matt Simpson - data source: ABS, LSEG
- GDP rose 0.6% q/q, in line with its long-term average, while per capita growth edged up 0.2% q/q.
- Domestic final demand increased 0.5% q/q, though this was the slowest pace since 2022.
- Hours worked expanded for a fifth straight quarter (+0.5% in Q2).
- Productivity improved, with real gross value-added hours rising 0.5% (a five-month high).
The Australian dollar firmed slightly after the release, largely on reduced RBA cut expectations, though markets had already priced in a low probability of near-term easing. Beneath the headline strength, however, momentum within the economy looks to be cooling.
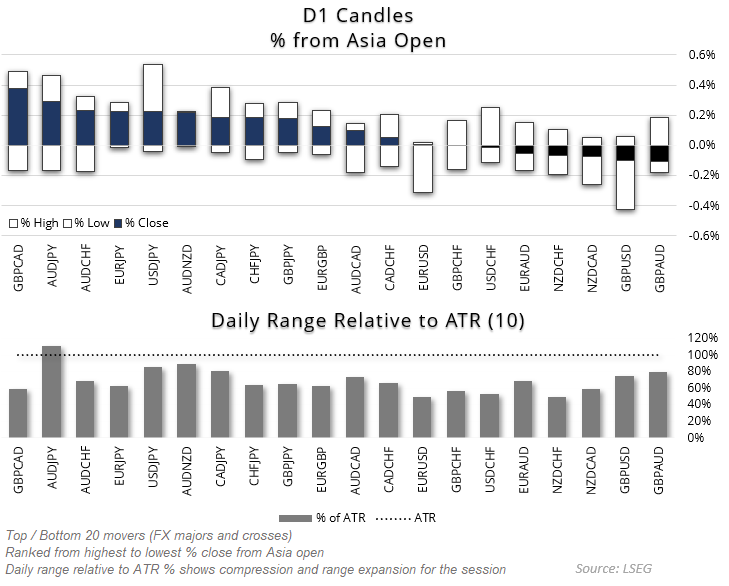
Chart prepared by Matt Simpson - data source: LSEG
- AUD/NZD climbed to a six-month high, trading near 1.1133.
- AUD/JPY extended gains above 97, on track for a sixth consecutive daily rise, with February and July highs now within reach.
- AUD/USD is holding above the 20-day EMA but is struggling to build momentum, with intraday ranges tight.
- AUD/CAD is pressing towards resistance at 0.90, though without a fresh catalyst a swing high could soon emerge.
AUD/USD Technical Analysis: Australian Dollar vs US Dollar
AUD/USD formed a bearish engulfing candle on Tuesday’s daily chart, hinting that the week’s high may already be locked in. On the 1-hour timeframe, price action is retracing higher from Tuesday’s sharp selloff, but the structure resembles a three-wave counter-trend correction rather than a sustainable rally.
Bears may look to fade minor rallies while price remains capped beneath the weekly high, keeping the near-term bearish bias intact. A move back towards the 200-day EMA at 0.6460 remains a realistic downside target.
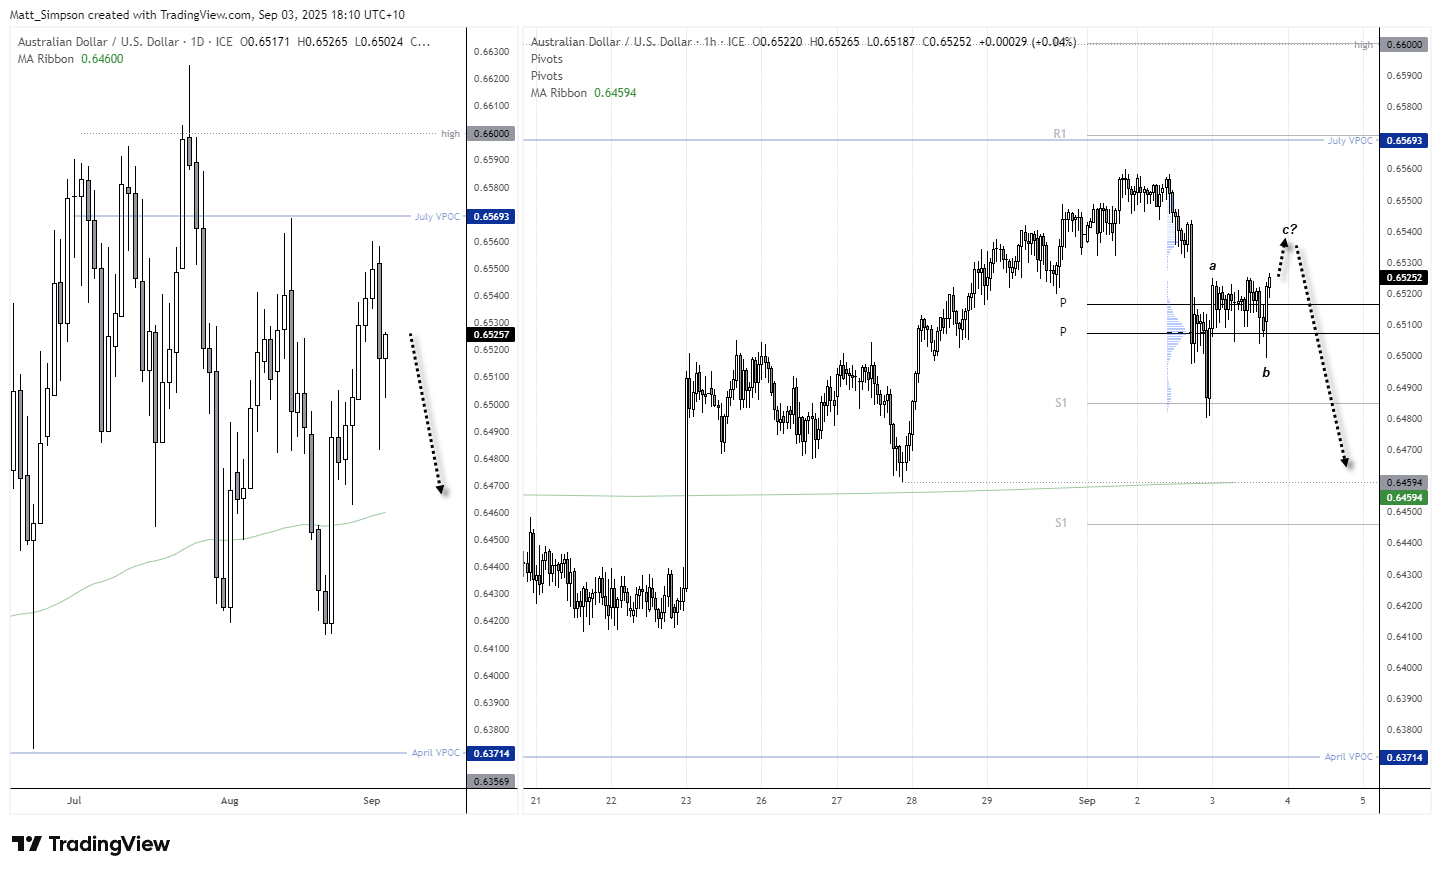
Chart analysis by Matt Simpson - data source: TradingView AUD/USD
View the full economic calendar
-- Written by Matt Simpson
Follow Matt on Twitter @cLeverEdge
How to trade with City Index
You can trade with City Index by following these four easy steps:
- Open an account, or log in if you’re already a customer
• Open an account in the UK
• Open an account in Australia
• Open an account in Singapore
- Search for the market you want to trade in our award-winning platform
- Choose your position and size, and your stop and limit levels
- Place the trade


