


The Reserve Bank of Australia delivered another 25bp hike, lifting the cash rate to 4.1% as inflation risks re-emerge. Rising inflation expectations and geopolitical-driven energy prices are complicating the outlook, while a divided board highlights just how finely balanced the decision was.
For FX traders, the focus now shifts to whether the RBA can follow up with another move in May, and how that stacks against a Federal Reserve that may struggle to deliver a dovish pivot. That leaves AUD/USD vulnerable near cycle highs, while EUR/AUD continues to trend lower towards key support levels.
View related analysis:
- US Dollar Outlook: FOMC Decision Meets Crude Oil Price Shock
- FX Futures Positioning: USD, EUR, GBP, JPY | COT report
- Australian Dollar Outlook: RBA Rate Decision and AUD/USD Pullback Risks
- Gold Slips as Crude Oil Surges on Middle East Tensions
RBA Rate Hike Lifts Inflation Risks as AUD/USD and EUR/AUD Reach Key Levels
The Reserve Bank of Australia (RBA) hiked its cash rate by 25bp to 4.1%. Expectations were not one-sided heading into the decision, although economists and market pricing leaned towards a hike. The fact that only five of the nine voting members supported the move highlights just how finely balanced the decision was, with a credible case to hold despite a pickup in economic activity.
The RBA noted that capacity pressures and rising short-term inflation expectations have increased upside risks to the inflation outlook. Clearly, the war in Iran has contributed to these inflationary pressures, which are likely to remain elevated if tensions in the Middle East persist. However, this is a double-edged sword: if the conflict drags on long enough for higher oil prices to materially weigh on growth, the case for further tightening weakens and expectations for cuts could begin to re-emerge.

Source: RBA, LSEG
Ultimately, the RBA likely felt it had little choice but to hike, but there was limited benefit in delivering an overly hawkish message. The RBA next meets on May 5, which allows for two more employment and inflation reports, along with more time to assess how the Middle East conflict evolves.
Ultimately, the RBA would likely have delivered a more hawkish tone were it not for the war in Iran — and that has taken some wind out of the Australian dollar’s sails. That said, as things stand, the RBA still appears likely to hike again in May.

Australian Dolar (AUD) Technical Analysis
The Australian dollar is higher across the board today, though it has handed back much of its earlier gains. That said, neither has it triggered much of a pullback given markets are likely on guard for a May hike anyway.
- AUD/NZD remains near its cycle highs and treading water just below 1.21. A technical pullback could be argued, though its strong bullish trend seems likely to tempt bulls.
- AUD/CAD has met resistance around 0.97. Given its false break of the Feb high and 2023 high, I currently have a neutral bias
- EUR/AUD remains within a strong downtrend and on track for a record-breaking thirteenth week lower
AUD/USD Turns Choppy as Fed Risk Caps Upside
The weekly chart shows the rally has entered a choppy phase around 0.70, with a bearish engulfing candle and a shooting star forming over the past two weeks. While AUD/USD is attempting to snap that two-week losing streak, bulls may struggle to take out last week’s high for now. The rally already looks stretched, positioning appears extended, and this week’s Fed meeting is a key risk event.
My base case is that the Fed will struggle to deliver a dovish tone, with a risk that the dot plot further reduces the odds of even a single cut this year — in turn supporting the US dollar. That could provide additional headwinds for the Aussie, or trigger a pullback if the US Dollar Index pushes towards 101 and potentially 102, as currently expected.
The daily chart shows price action remains choppy, trading near the middle of that range. I hold a neutral bias at current levels and prefer range-trading strategies while prices remain between the 2023 and 2024 highs.
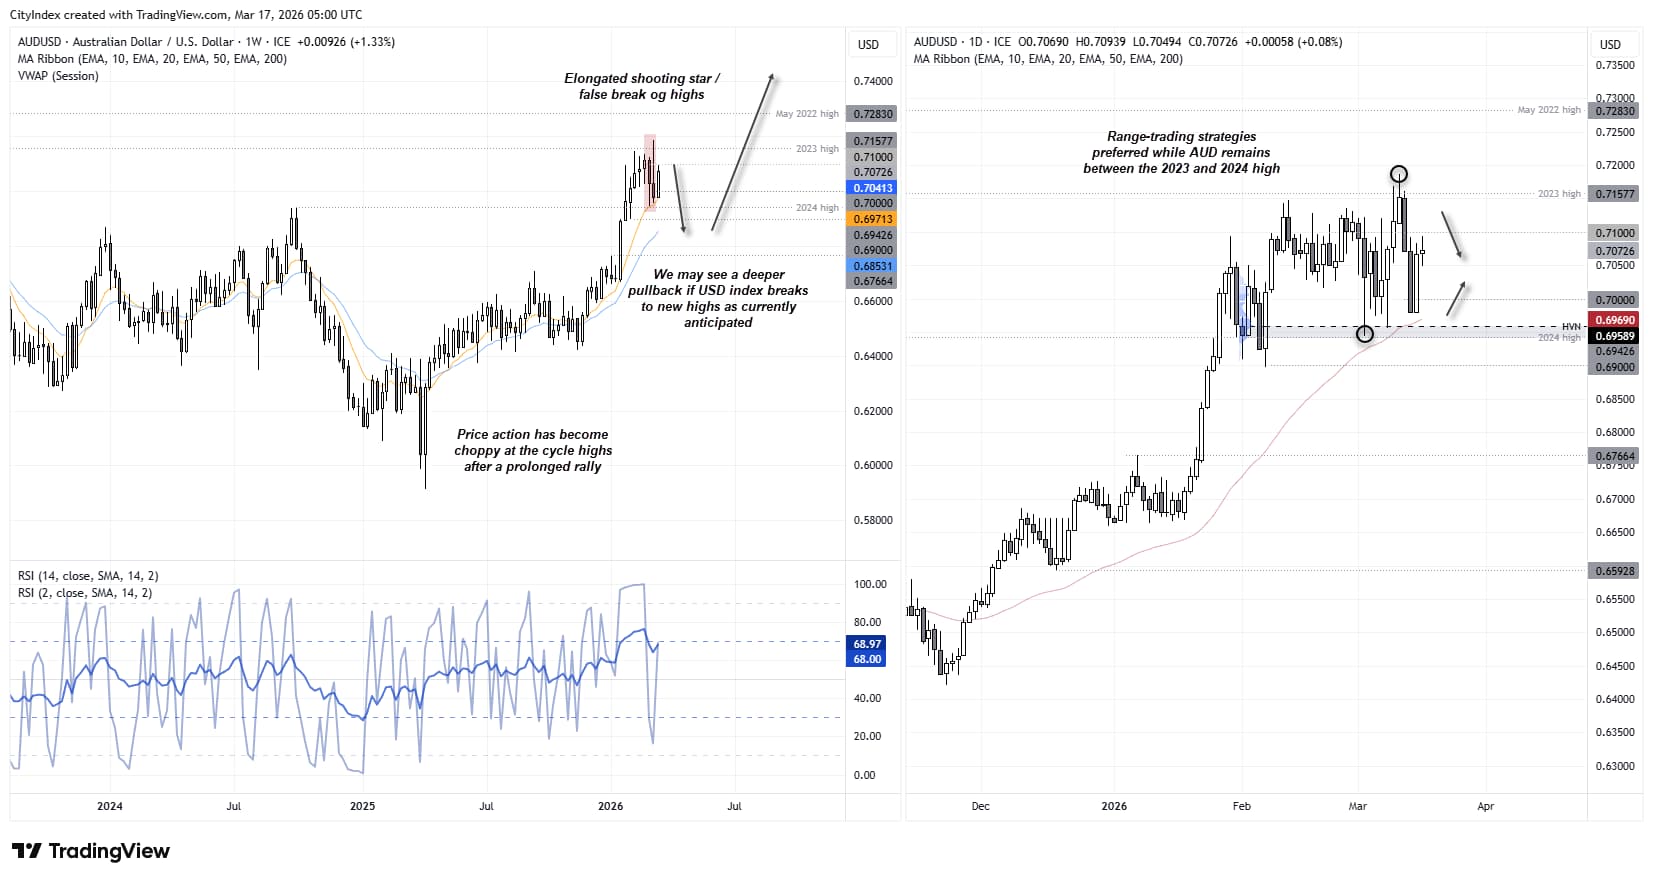
Source: ICE, TradingView

EUR/AUD Technical Analysis: Euro vs Australian Dollar
Momentum remains firmly with the bears, although the move may be closer to exhaustion than its beginning or middle stages. Last week’s candle printed a notable lower wick on the twelfth consecutive bearish week, with RSI deeply oversold. With 1.60 support now within a typical week’s range, bears may already be considering lightening positions. That said, EUR/AUD could still attempt a push towards the 1.60 handle.
The daily chart shows a two-bar reversal (dark cloud cover) formed on Tuesday, in line with the broader bearish trend. Bears may look to fade retracements within Monday’s range while maintaining a near-term bearish bias below 1.64, with 1.60 remaining the key downside level.
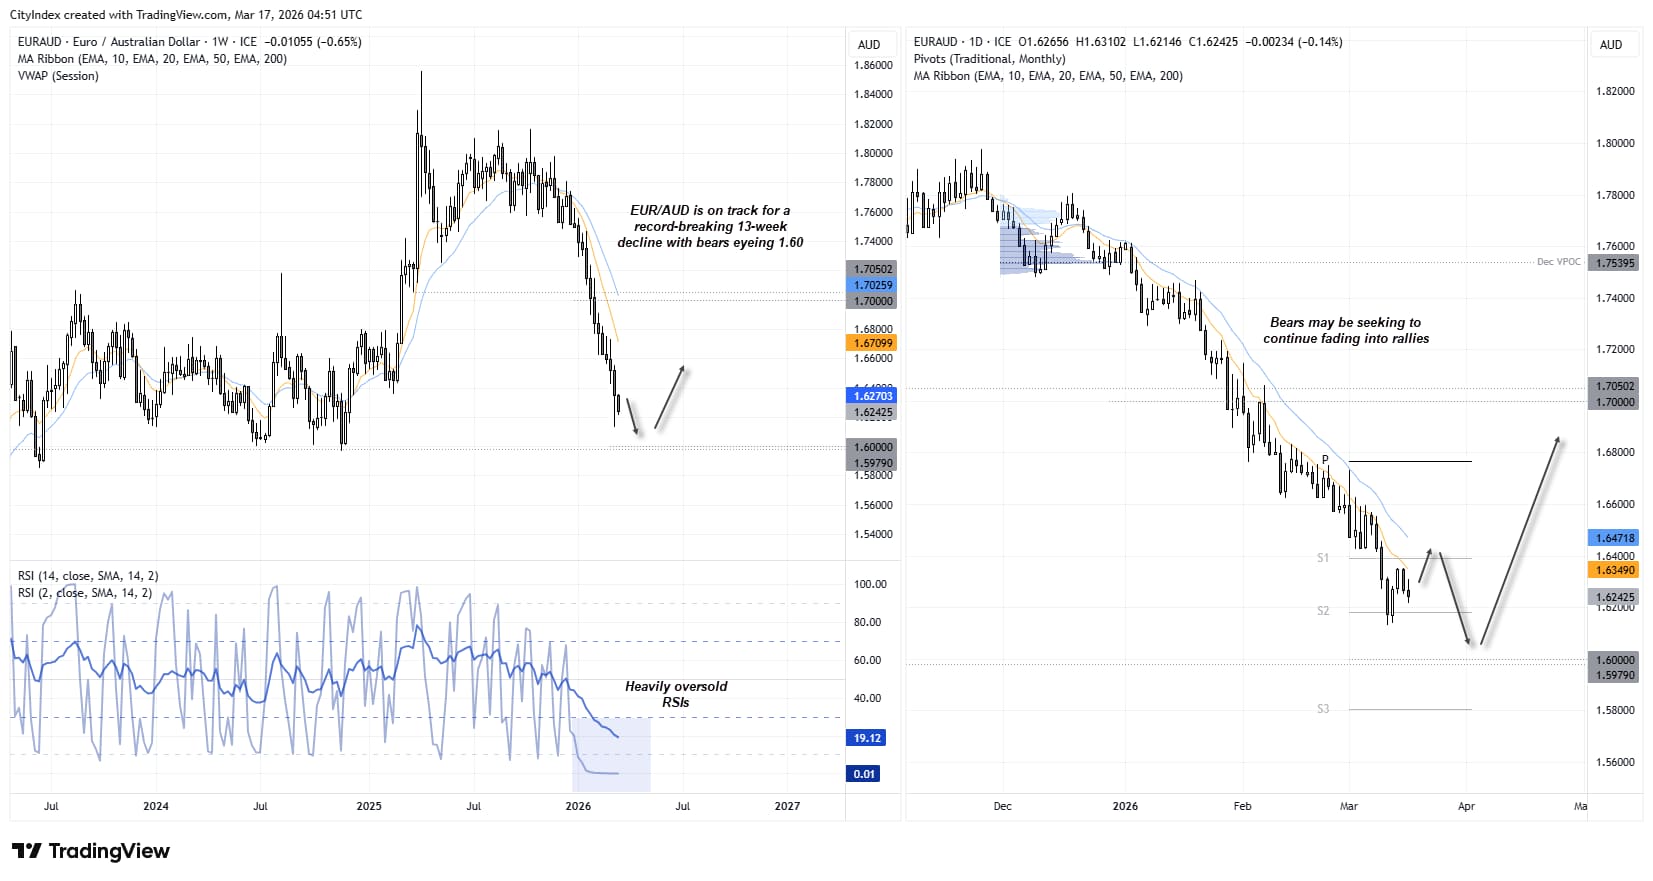
Source: ICE, TradingView
View the full economic calendar
-- Written by Matt Simpson
Follow Matt on Twitter @cLeverEdge
How to trade with City Index
You can trade with City Index by following these four easy steps:
- Open an account, or log in if you’re already a customer
• Open an account in the UK
• Open an account in Australia
• Open an account in Singapore
- Search for the market you want to trade in our award-winning platform
- Choose your position and size, and your stop and limit levels
- Place the trade


