


- Noisy Australia jobs report, trend measures tell a steadier story
- RBA hike pricing climbs as energy shock lifts inflation expectations
- AUD/USD lifts in Asia as overnight USD surge corrects
The signal problem
The February Australian labour force report is messy once you look beneath the surface, making it difficult to draw a clean signal from the headline moves. There’s a risk we’re looking at statistical noise rather than a meaningful shift in conditions, something the trend measures support.
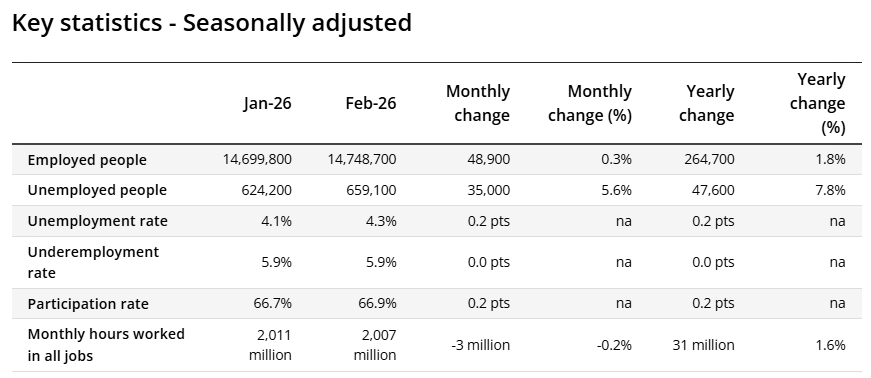
Source: ABS
Employment rose by 49,000 from January, but the split between full-time and part-time work muddied the waters. Part-time roles jumped by 79,000 while full-time employment fell by 30,000, reversing the pattern of the prior two months. That lines up with the 0.2% decline in hours worked, pointing to softer labour utilisation rather than a weakening in demand.
The increase in unemployment was driven more by supply than demand. Participation rose to 66.9%, driven by older Australians remaining in or re-entering the workforce rather than retiring, helping push the unemployment rate up to 4.3%. The ABS noted fewer people moved from unemployment into jobs and more remained unemployed, but the broader signal still looks mixed.
Importantly, wider measures of labour market conditions were steady. Underemployment, covering those who have a job but want and are available to work more hours, held steady at 5.9%, while the trend unemployment rate edged lower to 4.2%.
Set against the RBA’s February forecasts, conditions still look relatively firm. The Bank expects unemployment to average 5.3% in the first half of 2026, and even with the lift this month, the average soi far remains below that level.
Inflation impulse takes over
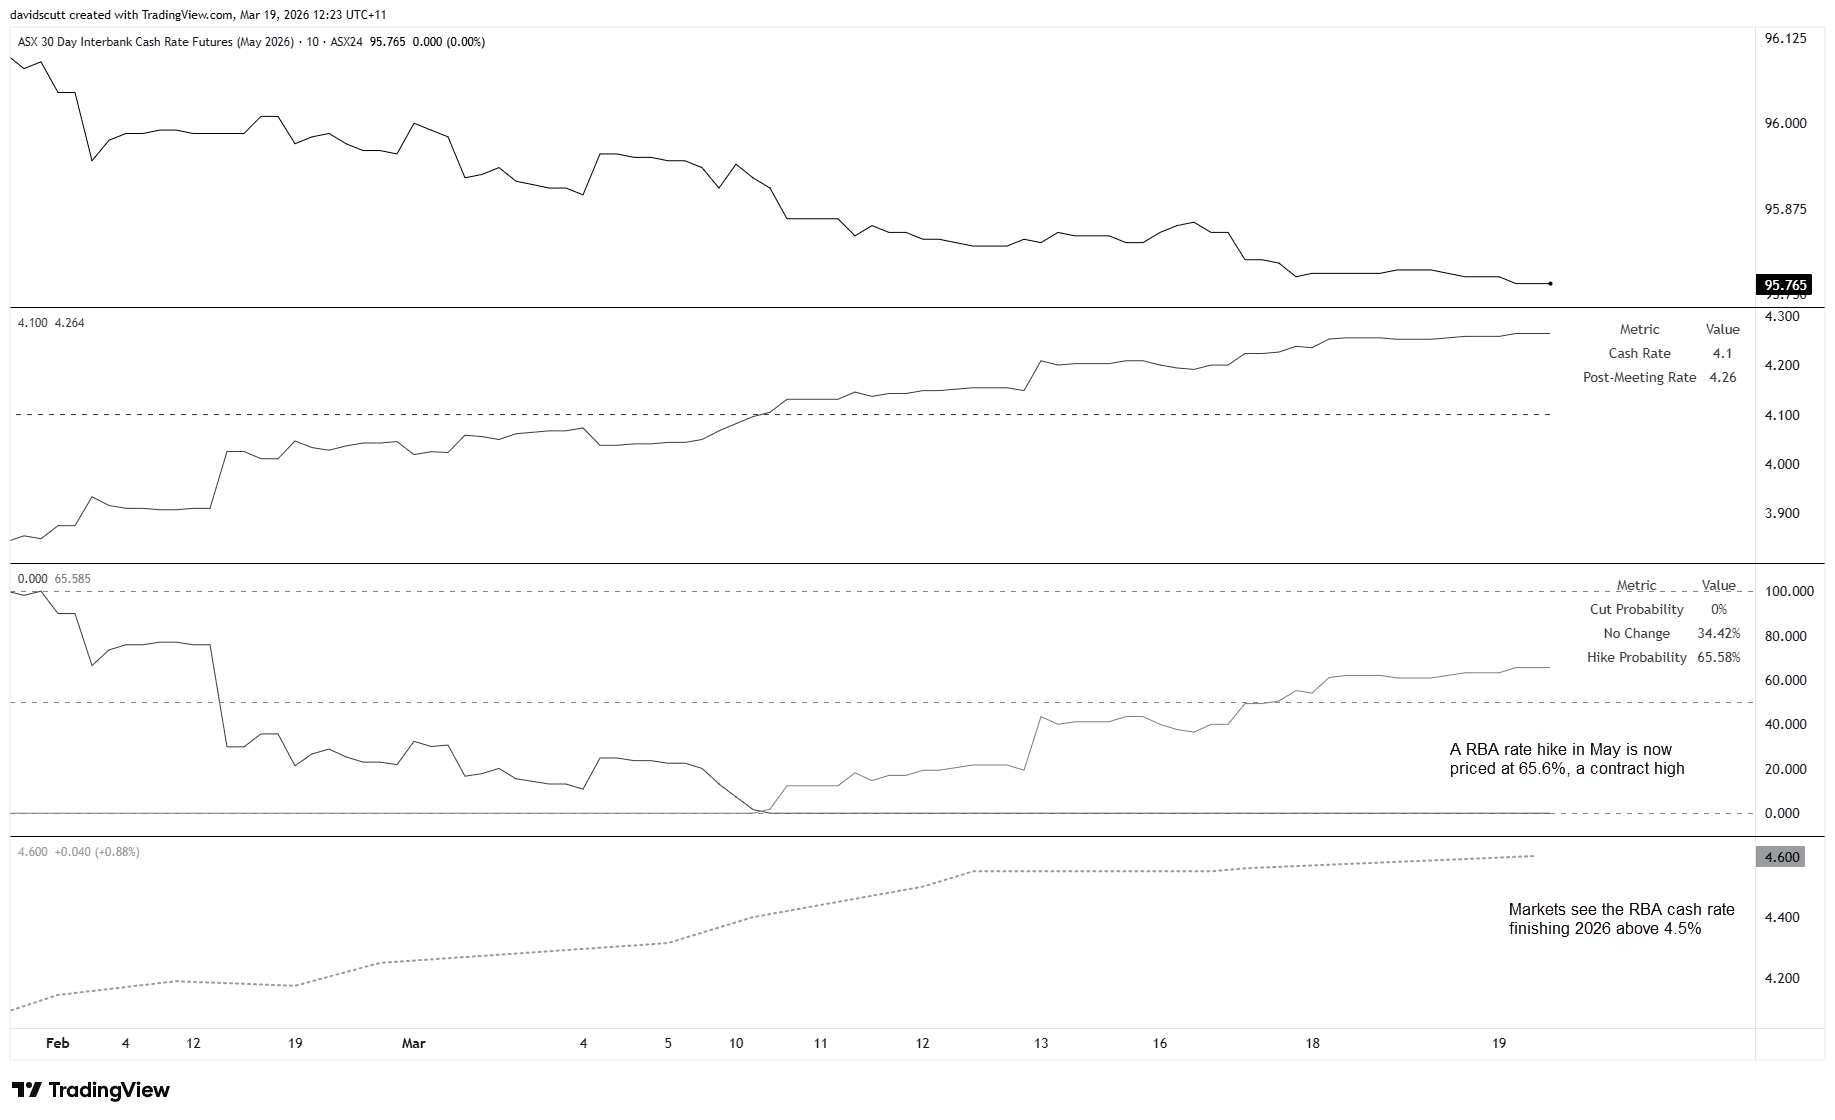
Source: TradingView
Markets ignored the detail entirely with pricing for a May RBA hike pushing to contract highs, with implied odds moving above 65%. That move looks driven less by anything in this report and more by the inflation impulse coming from offshore, with surging energy prices tied to the Iran conflict lifting inflation expectations and, in turn, rate hike expectations.
Adding to the sense traders have their eyes elsewhere, AUD/USD pushed to session highs shortly after the report's release.
Asia corrects the flush
The pair was hammered overnight on the back of surging energy prices as Middle Eastern tensions intensified, with Israel and Iran launching attacks against gas infrastructure, boosting the USD. The greenback also found support from the March FOMC which carried a notably hawkish tone, with only one dissent against holding rates steady. There was also focus on Jerome Powell acknowledging he would remain at the Fed while a Department of Justice investigation into cost blowouts tied to building renovations is ongoing, including as chair until if and when Kevin Warsh secures approval from lawmakers.
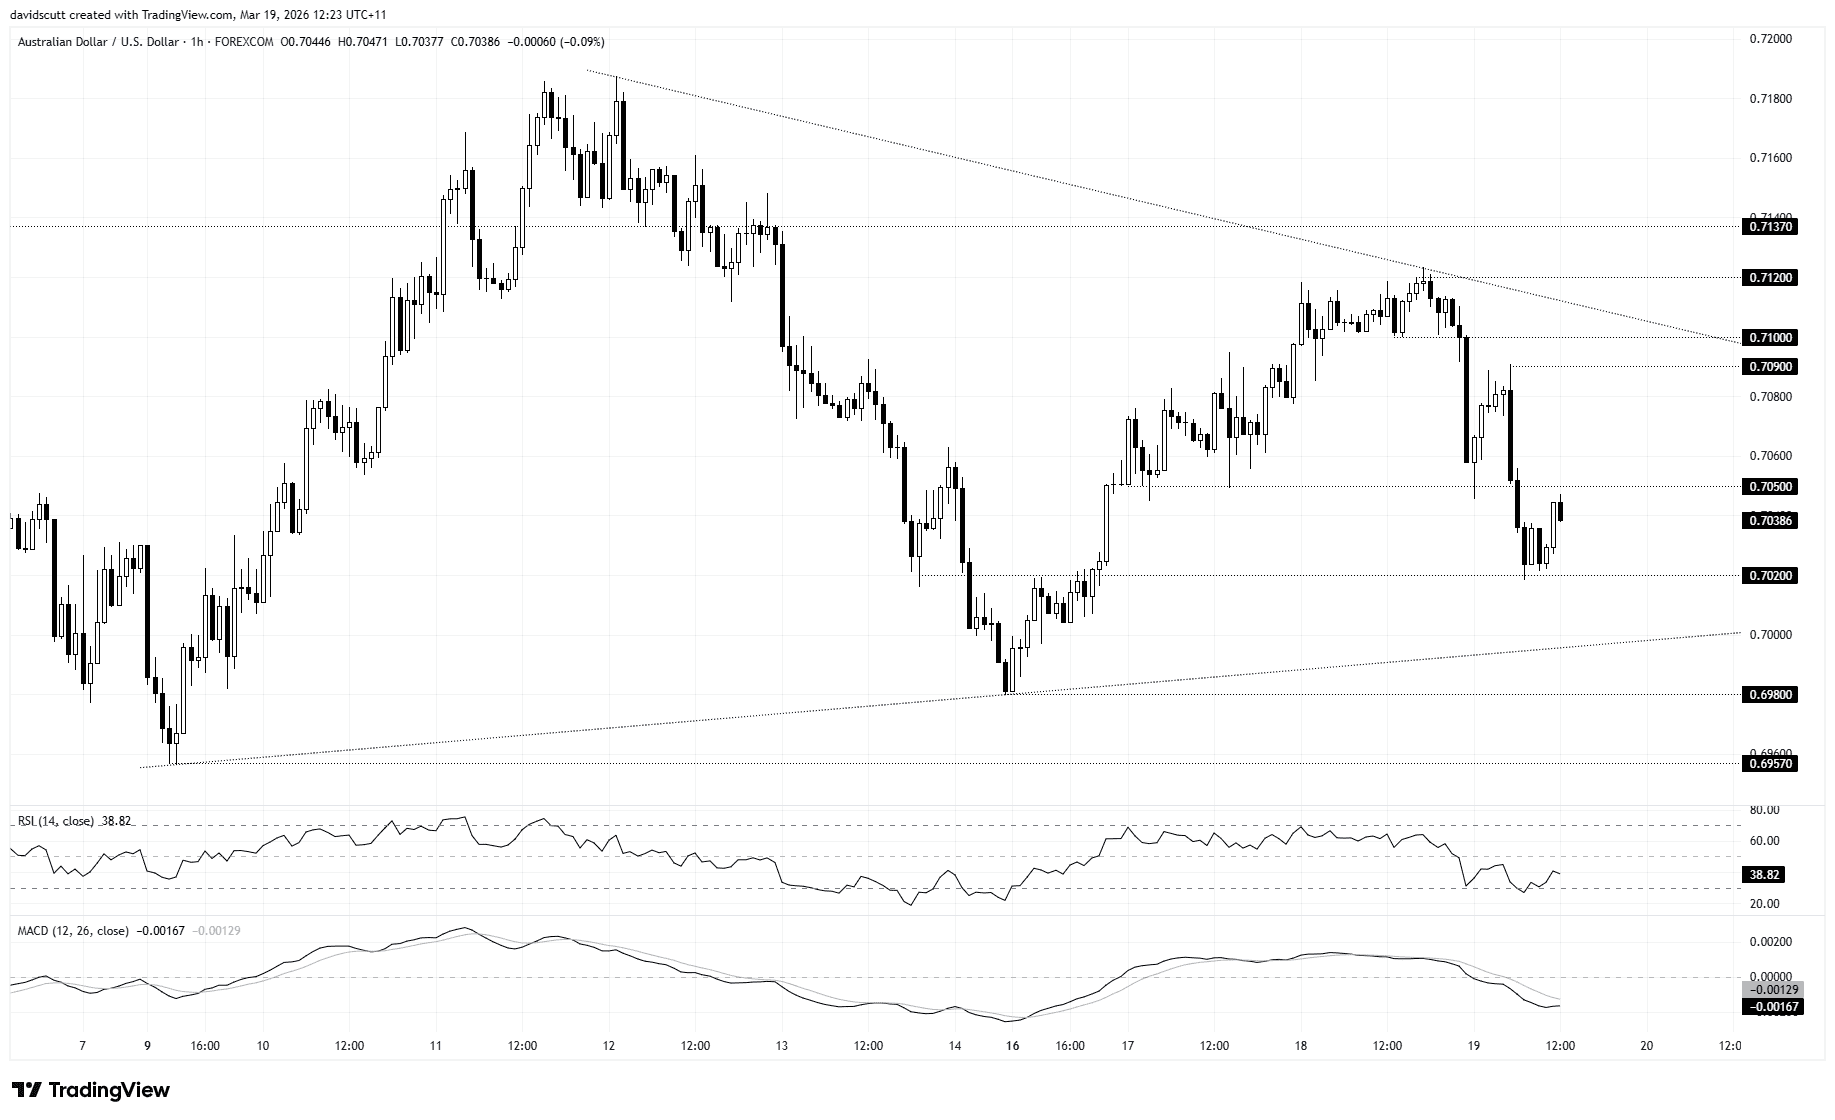
Source: TradingView
The bounce in Asia looks corrective following that downside flush, something often seen following large moves during North American trade. The Aussie found support ahead of 0.7020 following the Fed before rebounding towards 0.7050, a level that had previously acted as support prior to the break lower. That defines the initial range on the hourly.
Above, 0.7090 marks the high struck just before the Fed, with 0.7100 sitting just above as another former support level that may now act as resistance. Just beyond that sits the downtrend from the YTD highs set earlier this month, making it an important reference point.
Below 0.7020, the uptrend from the March 9 lows sits just under 0.7000, a level that has consistently attracted buyers in recent weeks. A break of that trend would bring the 0.6980 swing low from last week into play.
Momentum signals suggest downside pressure may be easing. RSI (14) has started to print higher lows while remaining below 50, while MACD is curling back towards the signal line but remains in negative territory, pointing to downside risks becoming less pronounced rather than reversing outright.


