


The persistent US government shutdown has generally kept a lid on runaway volatility across major forex pairs. Fortunately, traders still had some action this week — with a mini-rout in gold and an explosive move higher in crude oil prices keeping things lively. But with US CPI data due later today, there’s potential for volatility to return ahead of the weekend.
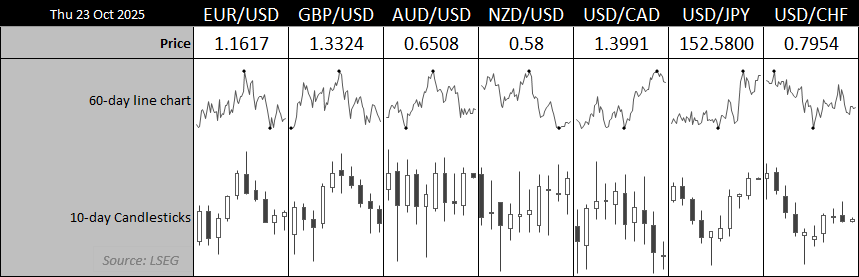
Chart analysis by Matt Simpson - Source: LSEG
View related analysis:
- With US Dollar ‘Rebound’ Waning, EUR/USD and GBP/USD Could Bounce
- Australian Dollar Consolidates: AUD/USD, EUR/AUD Near Pivotal Levels
- Japanese Yen Price Action Setups: USD/JPY, EUR/JPY, AUD/JPY
- Bitcoin Bears At Risk of Short Squeeze Unless Prices Continue Lower
AUD/USD and GBP/USD Eye Breakout Zones as US CPI Looms
US Inflation in Focus
Headline CPI is expected to rise to 3.1% year-on-year, while core CPI is forecast to hold steady at 3.1% year-on-year and 0.3% month-on-month. Money markets are currently pricing in a 25bp rate cut from the Fed next week and another in December, with implied probabilities of 99% and 93% respectively. A hotter-than-expected CPI print could challenge those expectations and send the US dollar higher across the board.

Chart analysis by Matt Simpson - Source: LSEG, Investing.com
Still, my hunch is that inflation will come in softer, supporting current market pricing. As noted in recent articles, I suspect the US dollar’s rebound this week is nearing an inflection point — and its next meaningful move is likely lower.
That scenario could bode well for the Australian dollar heading into next week, particularly with Australia’s key inflation report on the horizon for the RBA.

AUD/USD Technical Analysis: Australian Dollar vs US Dollar
The daily chart shows the Australian dollar has continued to trade sideways over the past couple of weeks. Since last Wednesday, however, the open and close prices have mostly held above the September low. AUD/USD’s open-to-close range has remained below 35 pips since last Tuesday, and daily ranges have been trending lower. This suggests prices are coiling above support — often a precursor to increased volatility.
At this stage, my hunch is that AUD/USD will initially break higher from its current range before meeting resistance below 0.6550, or perhaps around the descending trendline. Whether the pair then continues to break higher or reverse lower likely depends on the tone of next week’s FOMC meeting and Australia’s quarterly inflation figures.
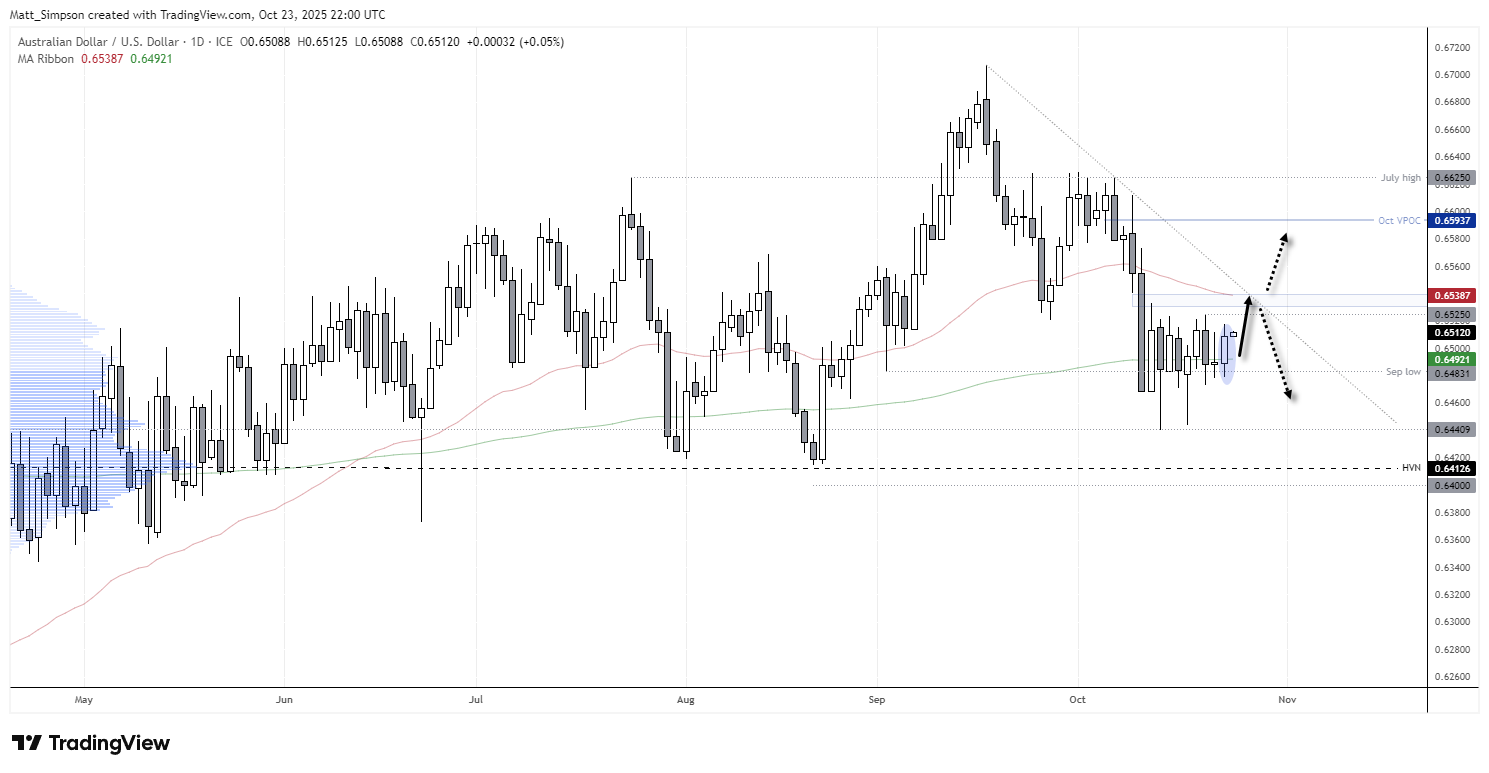
Chart analysis by Matt Simpson - data source: TradingView AUD/USD

GBP/USD Technical Analysis: British Pound vs US Dollar
Mostly based on the assumption that the US dollar will top out, I have provided a bullish bias for the British pound against the US dollar – should it hold above Wednesday’s low. The daily chart shows that this is being stretched, and there may need to be some wriggle room for some CPI-related noise beneath Wednesday’s low to allow the potential for a bounce to breath.
While bets are now being renewed for a Bank of England (BOE) cut, GBP/USD has already fallen for five consecutive days. The daily RSI (2) is in the oversold zone, and prices are trying to hold above that hammer low, for now at least.
ON the basis that the 200-day EMA is a tough nut to crack and my hunch for a weaker US dollar, I’ll stick to my guns and eek a move higher on the GBP/USD daily chart, with the 50-day EMA as a potential bullish target.
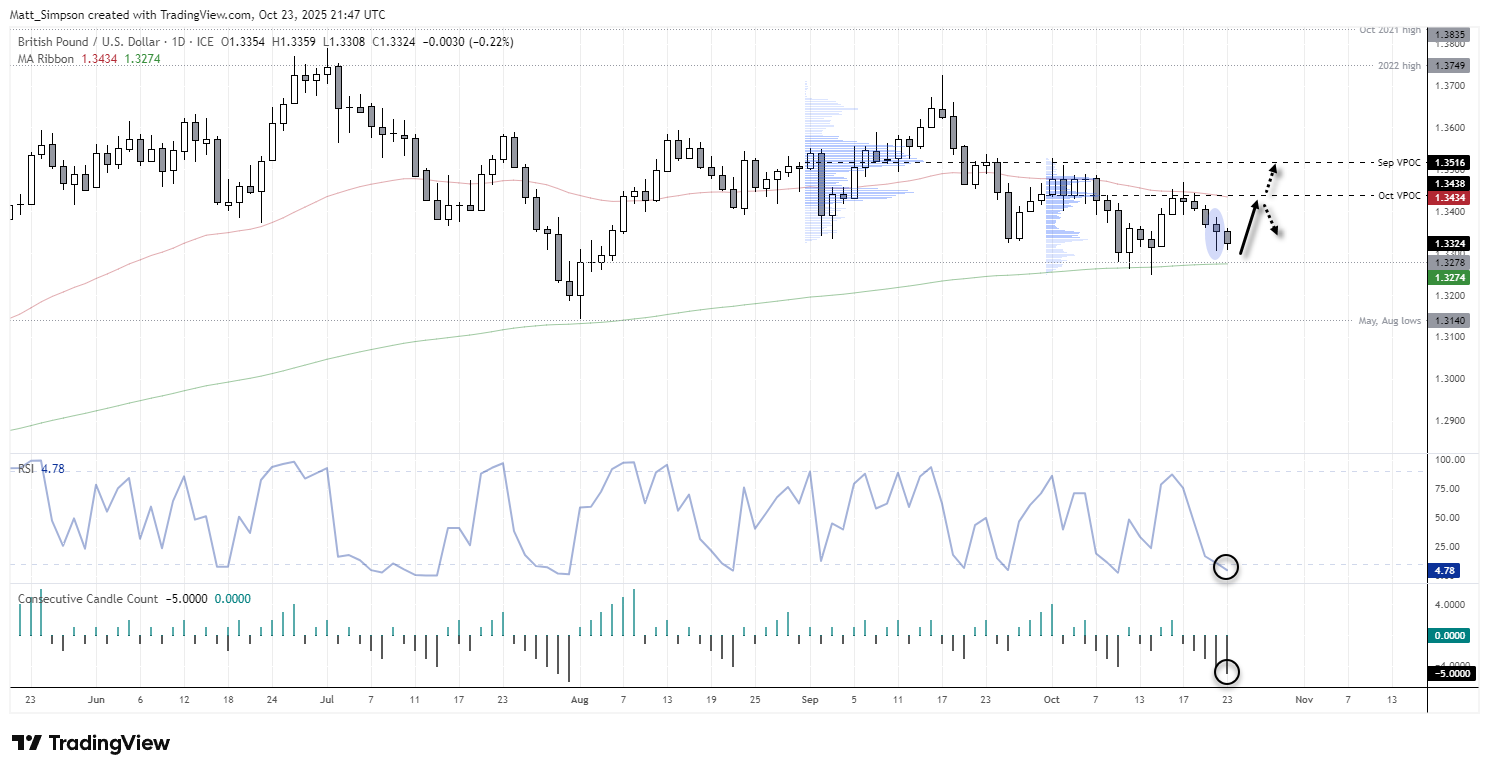
Chart analysis by Matt Simpson - data source: TradingView GBP/USD
View the full economic calendar
-- Written by Matt Simpson
Follow Matt on Twitter @cLeverEdge
How to trade with City Index
You can trade with City Index by following these four easy steps:
- Open an account, or log in if you’re already a customer
• Open an account in the UK
• Open an account in Australia
• Open an account in Singapore
- Search for the market you want to trade in our award-winning platform
- Choose your position and size, and your stop and limit levels
- Place the trade


