


The Australian dollar enters the second half of 2025 on stronger footing, having recovered from a brief dip below 60c and finding resistance near 65c. With Trump’s tariff shock now fading into the background, traders are refocusing on central bank policy and macro fundamentals.
Both the Federal Reserve and Reserve Bank of Australia are expected to cut rates by 50bp in H2, limiting monetary policy divergence. As a result, the outlook for AUD/USD may hinge more on risk sentiment and broader US dollar moves than on rate differentials. If global markets continue to bet on a soft landing and the Fed begins its easing cycle, AUD/USD could push above 70c before year-end.
AUD/USD H2 Outlook: Can the Australian Dollar Sustain Its Recovery?
- With Trump’s tariffs are in the rearview mirror, traders should be able to refocus on monetary policy and see a return of yields driving currencies
- US and Australian economies have softened in the first half of the year
- Fed and RBA likely to cut by 50bp each in H2, keeping AUD/USD within ranges
- AUD/USD dips likely to be bought, magnitude of the Australian dollar’s rally to be dictated by appetite for risk
AUD/USD Q3 Outlook: Dips Favoured as Trump Trade Shock Fades
At the end of my Q2 report, I noted a bias for “AUD/USD ranges between 61–65c, with dips being bought toward the lower 60s, yet rallies fizzling out toward the mid-60s”. While the Australian dollar briefly dipped below 60c — and for less than three days — I’m pleased to see the rebound was capped right where expected, around 65c.
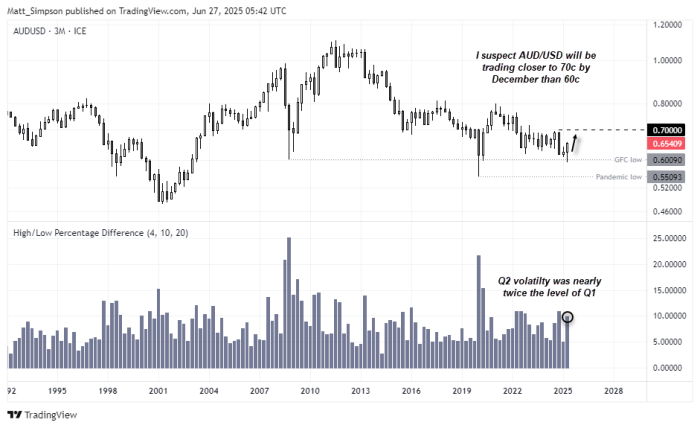
Chart prepared by Matt Simpson - Source: TradingView
Trump’s trade war delivered a near 10% range for AUD/USD in Q2 — nearly double the volatility seen in Q1. But with those tariff threats now fading, I expect Q3 volatility to settle somewhere between the 5–10% range seen so far this year.
Ultimately, I suspect bulls are on standby to buy dips on the Australian dollar, with a higher probability of AUD/USD making a run towards 70c by year end than falling back below 70c. The quarterly chart shows strong support around 60c, and the bullish engulfing quarter could mark a significant low for the Australian dollar.
Trump Tighten to The Screws on Powell, Fed Independence
While Trump began his second term with a surprisingly conciliatory tone toward Jerome Powell, that goodwill didn’t last. He’s since called the Fed Chair a “moron” (among other things) and demanded a 100bp rate cut. Now, reports suggest Trump is actively looking to replace Powell before his term ends in May 2026.
Legally, Trump doesn’t have the authority to remove Powell without proving serious misconduct — but that likely won’t stop him from searching for a workaround. Should he succeed, the market would expect him to install a reliably dovish replacement, heightening the prospect of politically motivated rate cuts.
This isn’t an immediate threat, but markets are already leaning short on the US dollar. Trump’s trade war is seemingly in the rearview mirror and geopolitical tensions are lower with the ceasefire between Israel and Iran holding up. Traders are now reverting their focus to the potential for the Fed to ease policy. Whether the Fed caves under political pressure or Trump ultimately gets his way, traders are betting on easier policy ahead.
September Seems Ripe For A Fed Cut
In fairness to President Trump, Fed cuts are likely warranted. The final release of Q1 growth saw it fall -0.5% q/q and real consumer spending was downgraded to 0.5% q/q. Consumer sentiment has also tumbled in H1, and some employment metrics are deteriorating.
Markets are currently pricing in two 25bp Fed cuts in H2, with Fed Fund Futures implying a 75% chance of a September cut and a 58% chance of one in October. I suspect the Fed will cut in September and December to end 2025 with a target range of 3.75% - 4.00%.

Chart prepared by Matt Simpson - Source: CME FedWatch
RBA to Cut at Least Twice in the Second Half
At least two rate cuts from the RBA in the second half of this year seem plausible. Q1 GDP was soft, retail spending remains lacklustre, and inflation continues to ease. However, a third cut would likely require a clear deterioration in employment data — which is also possible given the weak growth seen so far in 2025. The RBA also has five meetings between July and December to space out any easing.
Assuming a July cut is all but locked in, the September meeting could also be live for another 25bp move. From there, the data will determine whether the RBA proceeds with a third cut, potentially taking the cash rate to 3.35% in Q4. An alternative scenario is a 15bp cut to return the cash rate to its traditional quarter-point bracket — also landing at 3.25% by year-end.
Unless the data softens significantly from here, 100bp of cuts in H2 seems unlikely, especially given Australia’s still-robust labour market.
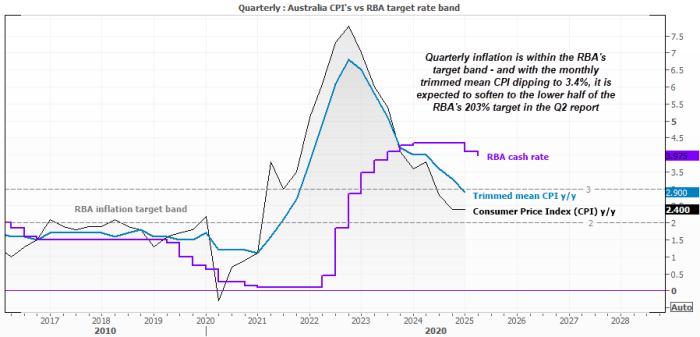
Chart prepared by Matt Simpson - Source: LSEG Workspace, Australian Bureau of Statistics (ABS), Reserve Bank of Australia (RBA)
Central Bank Meetings: Dates for Fed, RBA in 2025 H2
- 8 July 2025: RBA Cash rate Decision (-25bp cut expected)
- 30 July 2025: Fed Interest Rate Decision
- 12 August 2025: RBA Cash rate Decision
- 17 September 2025: Fed Interest Rate Decision
- 30 September 2025: RBA Cash rate Decision
- 20 October 2025: Fed Interest Rate Decision
- 4 November 2025: RBA Cash rate Decision
- 9 December 2025: RBA Cash rate Decision
- 12 December 2025: Fed Interest Rate Decision, FOMC Projections
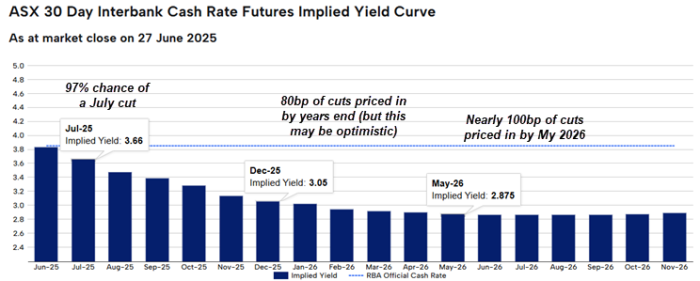
Chart prepared by Matt Simpson - Source: asx.com.au
Limited Fed–RBA Divergence May Support AUD/USD into Year-End
With both the Fed and RBA expected to cut rates by 50bp in H2, there’s limited scope for a significant monetary policy divergence or yield differential trend to develop. As a result, downside potential for AUD/USD may be constrained.
If anything, AUD/USD could face upward pressure into Q4 on the assumption that the Fed has more scope to cut rates in 2026 than the RBA. The extent of the Australian dollar’s upside may ultimately hinge on broader risk appetite — particularly if bets on a US soft landing trigger a Wall Street rally, dragging AUD/USD higher alongside.
Seasonality also tends to support the Australian dollar in Q4.

Chart prepared by Matt Simpson - Source: LSEG Workspace, Federal Reserve (Fed), Reserve Bank of Australia (RBA)
Australian Dollar Seasonal Trends: Bullish Bias Into Year-End
AUD/USD has historically shown a bullish bias from September through December, based on 54 years of data. October and December typically deliver the strongest average gains, with December marking the best-performing month of the year. While Q3 tends to produce negative average returns, the Australian dollar often begins to strengthen as it transitions into Q4.
If this seasonal pattern holds, AUD/USD could face a choppy Q3 with potential retracements before breaking to new cycle highs in the final quarter of the year.
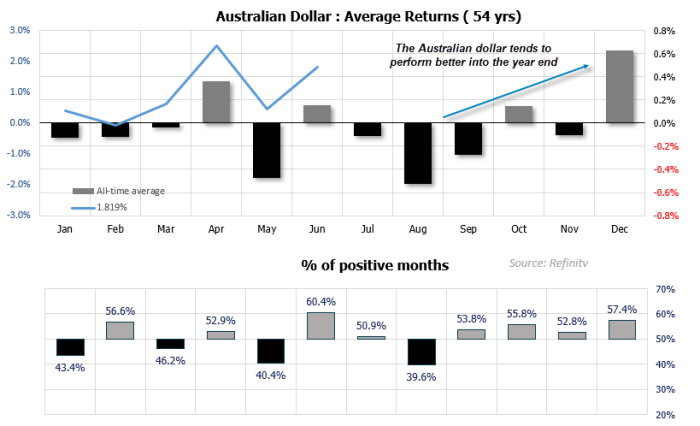
Chart prepared by Matt Simpson - Source: LSEG Workspace
AUD/USD Outlook: Potential Scenario for Australian Dollar in H2 2025
Most Bullish Scenario for AUD/USD in Q2:
- RBA only allowed to cut once in H2 as employment remains firm and inflation picks up as Trump’s tariffs filter through to global consumer prices
- US economic data sours, allowing the Fed to cut at least twice and ready to ease further in 2025
- Aud/USD could break above 70c, though it is important that the Fed are easing and markets expect a soft landing instead of a recession
Most Bearish Scenario for AUD/USD in Q2:
- US economic data accelerate lower, triggering concerns of a US (and therefore global) recession
- Wall Street indices are toppled, dragging AUD/USD lower during risk-off trade while the US dollar accepts safe-haven flows
- Australian economic data continues to weaken and employment finally rolls over, sparking fears of a recession in Australia
- Markets price in more cuts for Q4 and 2025
Most Likely Scenario (In My View):
- I think it most likely that the RBA will cut twice in H2, with the potential for a third cut in December in some time in Q1 to take the cash rate down to 3.1%
- The Fed will also cut twice in the second half this year, to see their interest rate band fall to 3.75% - 4.00% by year end
- However, expectation of future easing from the Fed in H1 2026 could weigh further on the US dollar and support AUD/USD into the year end


