


RBA Cut in Focus as Australian Inflation Slows Sharply in May
Australia’s inflation figures for May have all but confirmed a 25bp rate cut from the Reserve Bank of Australia (RBA) on July 8. This has been my preference for a couple of months now, though some economists have been playing it safely and spreading their bets for a cut in either July or August. But with inflation slowing to a 3.5 year low, the RBA could find it quite difficult to justify holding rates in two weeks’ time.
View related analysis:
- AUD/JPY Risks Breakdown as Momentum Fades Below 95.00 Resistance
- AUD/USD Weekly Outlook: Aussie Slides as Oil Surges on Middle East Tensions
- Australian Dollar Outlook: Will AUD/USD Follow NZD/USD Lower?
- AUD/USD, USD/CNH Outlook: US Dollar Hits Technical Juncture Ahead of FOMC
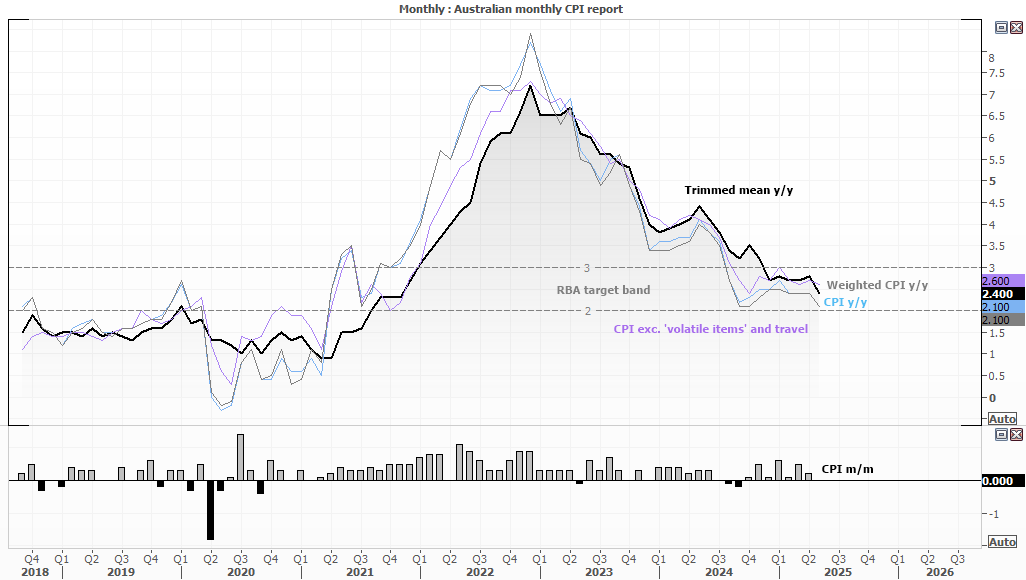
Highlights from Australia’s Monthly Inflation Report (May 2025)
- Trimmed-mean inflation slows to a 3-year, seven-month low of 2.4% y/y
- Its -0.4 percentage point drop in May was its fastest in five months
- Weighted CPI slows to a seven-month low of 2.1%
- Headline CPI also slowed to 2.1% y/y and was flat a 0% m/m
Australia’s Money Markets Price in an RBA Cut
The 1-month overnight index swap (OIS) sits at 3.7%, which marks a 60% probability of a 25bp cash rate next month. RBA cash rate futures imply ~90% chance of a cut, which is more in line with the reality of the situation. The 90-day bank bill futures market has fully priced in a 25bp cut to 3.6%, while the 3-year yield has fallen to 3.6%.
AUD/USD and yields to realign?
The relationship between yields and currencies broke down amid the Trump-tariff chaos. But with Trump’s trade war now heavily watered down and the Israel-Iran conflict also on its way to the backburner, perhaps the positive correlation between AUD/USD and the 3-year yield could be set to return.
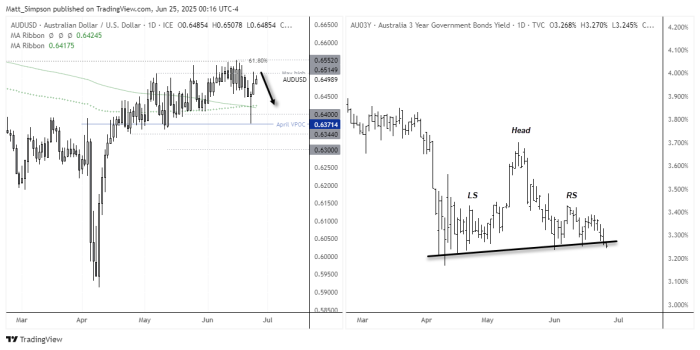
AUD/USD Technical Analysis: Australian Dollar vs US Dollar
A strong bullish pinbar formed on the daily chart of AUD/USD, and marked a false break of the 200-day SMA and EMAs. Prices are trying to rise for a third day despite the soft CPI print, but already its rebound is looking exhausted.
Note that Tuesday closed beneath 65c despite an intraday break above it, and prices have drifted back towards this key level during Asian trade. I suspect this is part of a false move, and bears may be waiting for moves back towards the cycle highs for fade into.
A move to the 200-day MAs around 0.6420 could be on the cards.
Australian 3-Year Yield analysis:
A head and shoulders top is forming on the 3-year yield. I feel it dubious to simply project the distance of the neckline to head for a lower target, as yields are expressed in percentages. But the pattern suggests a downside break for yields could be on the cards. And if I am correct in thinking the Australian dollar could rekindle its relationship with yields, a downside break on the 30year yield could spell trouble for the Australian dollar.
View the full economic calendar
-- Written by Matt Simpson
Follow Matt on Twitter @cLeverEdge
How to trade with City Index
You can trade with City Index by following these four easy steps:
- Open an account, or log in if you’re already a customer
• Open an account in the UK
• Open an account in Australia
• Open an account in Singapore
- Search for the market you want to trade in our award-winning platform
- Choose your position and size, and your stop and limit levels
- Place the trade


