


The Australian dollar was the strongest FX major on Monday as it retraced around half of Friday’s sell-off alongside other risk assets. Although the Aussie’s 0.7% gain was above its typical daily range, it remains dwarfed by the Trump-tariff-induced sell-off heading into the weekend.
Chart analysis by Matt Simpson, Source: TradingView, CME Futures
View related analysis:
- Japanese Yen Selloff Losing Steam, AUD/JPY and AUD/USD Bears Resurface
- Nasdaq, Crude Oil Plunge Amid Trump-Tariff Revival as Gold Holds Firm
- Australian Dollar Outlook: AUD/USD Sentiment Sours Into RBA Mins, Jobs
- COT Report: Traders Boost Yen Longs, Add to Aussie and Loonie Shorts
- AUD/USD Q4 Outlook: Bears Target Slower Growth, RBA Cut
Trump softened his rhetoric on China – a move traders know well from previous rounds of TACO (“Trump Always Chickens Out”). However, these moves pale in comparison to the V-bottom reversals seen in April, meaning traders should remain on guard for choppy trade ahead.
The Japanese yen was the weakest currency in what was ostensibly a risk-on session, though I suspect we’re approaching another bout of strength for yen traders — one that could see USD/JPY move lower once its post-weekend correction plays out.

AUD/USD Technical Analysis: Australian Dollar vs US Dollar
I noted yesterday that Friday saw AUD/USD close beyond its lower Keltner band – a technical level it rarely trades beyond – while the daily RSI (2) also entered oversold territory. In classic mean-reversion style, AUD/USD opened at the low of the day on Monday and recovered around half of Friday’s sell-off, in line with my near-term bias.
I suspect AUD/USD will see another cycle low on the daily chart, and I’ve pencilled in a move towards 64c or the August low, near the 0.6412 high-volume node (HVN). Also note the 200-day SMA at 0.6420, which could provide support, and the 50-day SMA that could act as resistance. However, the intraday timeframe also shows the potential for another leg higher before a swing high materialises.
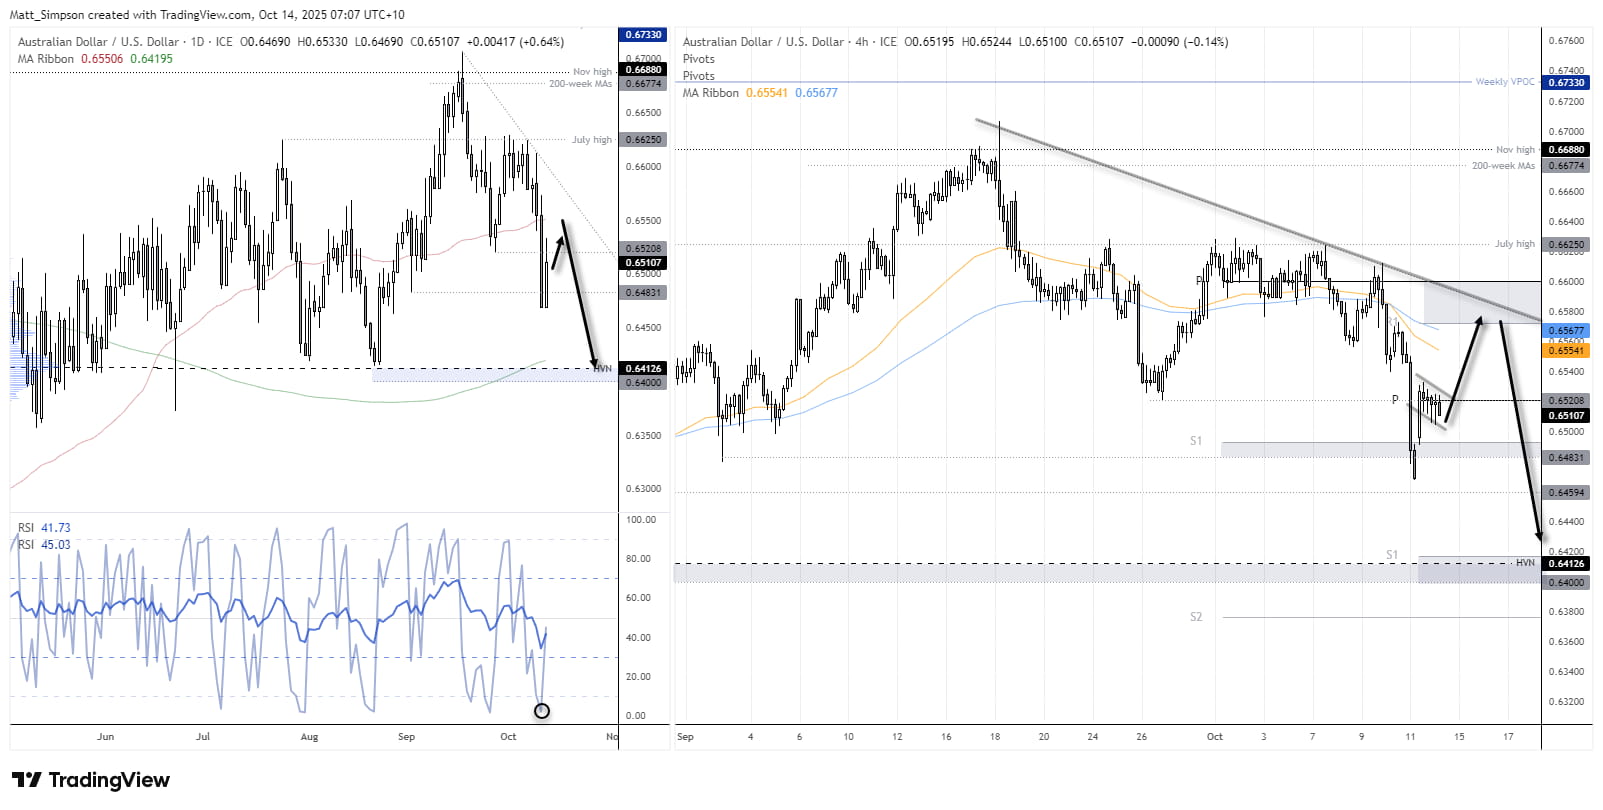
Chart analysis by Matt Simpson - data source: TradingView AUD/USD
AUD/USD Technical Analysis: 4-Hour Chart
A mini V-shaped bottom has formed on the intraday chart, though it hardly calls for a momentous rally at this stage. However, it has allowed a small bull flag to develop, which indicates the potential for another leg higher. Bulls could target the 10–20 bar EMAs around 0.6554–0.6567, the weekly R1 pivot at 0.6572, or the upper trendline over the near term. Bears, meanwhile, may look for evidence of a swing high around these levels in anticipation of the next leg lower.

USD/JPY Technical Analysis: US Dollar vs Japanese Yen
Last week I warned that the Japanese yen sell-off was losing steam. While I didn’t foresee the sharp reversal in favour of the yen that followed, I did note that USD/JPY bulls may have been pushing their luck. Like all yen pairs, USD/JPY formed a prominent bearish engulfing candle on Friday. A small bullish inside day formed on Monday, which is far from a convincing recovery for bulls. But with traders dealing with a shock to the system after such an extended move, they should remain nimble. However, a potential short setup may be surfacing on the 4-hour chart.

Chart analysis by Matt Simpson - data source: TradingView USD/JPY
USD/JPY Technical Analysis: 4-Hour Chart
Prices have retraced higher but stalled around a high-volume node (HVN) at 152.19, forming a small double top. We should allow for some wriggle room around today’s open, but I’m now looking for a swing high to form on the 4-hour chart. Also note the October VPOC at 152.67, which could cap price action as resistance.
Ultimately, my bias remains bearish on USD/JPY while prices hold beneath Friday’s high, with scope for a move down to at least Friday’s low — near the weekly pivot point and March high. Also note that the HVN at 150.34 and the 150 handle could provide support or serve as a target for bears.
Key Economic Events for Traders (AEST / GMT+10)
08:45 NZD Electronic Card Retail Sales (Sep) (NZD/USD, AUD/NZD, NZD/JPY)
10:01 GBP BRC Retail Sales Monitor (Sep) (GBP/USD, EUR/GBP, FTSE 100)
10:50 JPY M2 Money Stock, M3 Money Supply (Sep) (USD/JPY, EUR/JPY, Nikkei 225)
11:00 SGD GDP (Q3) (USD/SGD, EUR/SGD, STI Index)
11:30 AUD RBA Meeting Minutes, NAB Business Confidence, NAB Business Survey (Sep) (AUD/USD, AUD/JPY, ASX 200)
16:00 EUR CPI (Sep), Finnish CPI (Sep) (EUR/USD, EUR/GBP, DAX)
17:00 GBP Employment Report: Average Earnings, Claimant Count, Employment Change, Unemployment Rate (Aug/Sep) (GBP/USD, EUR/GBP, FTSE 100)
17:00 EUR German CPI, HICP (Sep) (EUR/USD, EUR/GBP, DAX)
17:30 CHF PPI (Sep) (USD/CHF, EUR/CHF, SMI Index)
19:00 USD IEA Monthly Report (WTI Crude, Brent Crude, USD/CAD)
20:00 EUR German ZEW Current Conditions, Economic Sentiment; ZEW Economic Sentiment (Oct) (EUR/USD, EUR/GBP, DAX)
20:00 CNY M2 Money Stock, New Loans, Outstanding Loan Growth, Total Social Financing (Sep) (USD/CNH, AUD/CNH, CN50 Index)
20:30 EUR German 2-Year Schatz Auction (EUR/USD, EUR/GBP, DAX)
20:30 ZAR Business Confidence, Gold & Mining Production (Aug/Sep) (USD/ZAR, EUR/ZAR, Gold futures)
21:00 USD IMF Meetings, NFIB Small Business Optimism (Sep) (S&P 500, Nasdaq 100, USD/JPY)
22:00 USD CB Employment Trends Index, Construction Spending, Wholesale Trade Sales (Aug/Sep) (S&P 500, Nasdaq 100, USD/JPY)
23:30 CAD Building Permits (Aug) (USD/CAD, EUR/CAD, CAD/JPY)
23:45 USD FOMC Member Bowman Speaks (S&P 500, Nasdaq 100, USD/JPY)
02:15 CAD BoC Senior Deputy Governor Rogers Speaks (USD/CAD, EUR/CAD, CAD/JPY)
03:20 USD Fed Chair Powell Speaks (S&P 500, Nasdaq 100, USD/JPY)
04:00 GBP BoE Governor Bailey Speaks (GBP/USD, EUR/GBP, FTSE 100)
06:25 USD Fed Waller Speaks (S&P 500, Nasdaq 100, USD/JPY)
06:30 USD Fed Collins Speaks (S&P 500, Nasdaq 100, USD/JPY)


