AUD/USD slid to a three-week low to start the week as crude oil prices soared following U.S. airstrikes on Iranian nuclear facilities. Rising geopolitical tensions have weighed heavily on risk appetite and increased safe-haven demand, dragging commodity currencies like the Australian dollar lower. With Australia’s monthly CPI due mid-week and Fed Chair Powell set to deliver testimony, markets are watching for signals on interest rate direction and global risk sentiment.
View related analysis:
- Australian Dollar Outlook: Will AUD/USD Follow NZD/USD Lower?
- AUD/USD, USD/CNH Outlook: US Dollar Hits Technical Juncture Ahead of FOMC
- Crude Oil Outlook: Strait of Hormuz Tensions Rise After U.S. Strikes Iran
- AUD/USD Weekly Forecast: Fed Decision and Australian Jobs Eyed
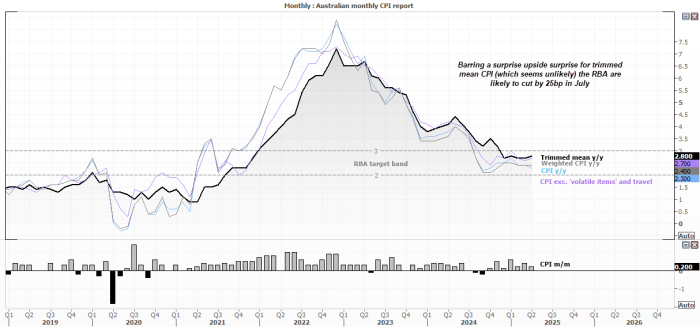
Australia’s Monthly CPI Report Could Cement an RBA Cut in July
Australia’s monthly inflation report is the last set of CPI figures to drop before the next RBA meeting. And unless we see a notable upside surprise, the RBA seem poised to cut by 25bp on July 8. While trimmed mean and weighed CPI ticked higher in April to 2.8% and 2.7% y/y respectively, they remain within the RBA’s 2-3% target band. Broad CPI slowed to a 4-year low of 2.3% y/y, and with soft growth and soft business sentiment to deal with, upside pressures to inflation seem far-fetched.
Employment figures from May were robust, though not on fire. And I suspect it is only a matter of time before we see the job market situation weaken (without crashing), which could justify at least one more 25bp cut in late Q3 or Q4. If for some reason the RBA opt to hold in July, August seems likely.
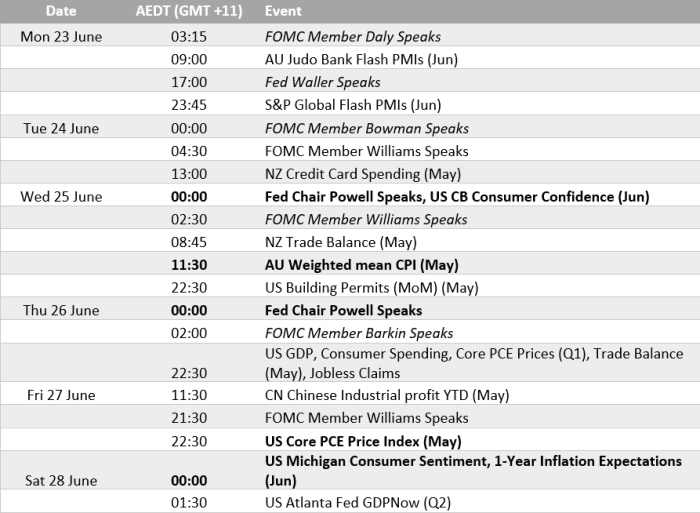
All Eyes on Powell’s Testimony After Cautious FOMC Outlook
Jerome Powell delivers his semi-annual monetary policy report testimony to the House Financial Services Committee late on Tuesday and Wednesday. Clearly this will gain a lot of attention, though it is debatable as to whether any surprises can be expected, arriving less than a week from the latest FOMC meeting. While Powell left the door open to a September cut, he also provided ample of wriggle room not to honour one. He also said it may “make a smart decision to wait a couple of months” before deciding on any change in policy. The Fed’s messaging was more focussed on the inflation side of things over the employment situation.
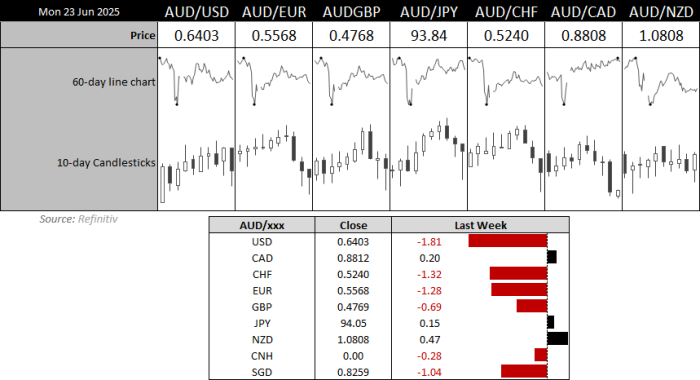
AUD/USD and NZD/USD: Tight Correlation Amid Middle East Risk-Off Sentiment
The recent bout of risk-off stemming from the Middle East has seen the correlation between AUD/USD and NZD/USD become very tight. They tend to track one another quite well regardless, though it is the New Zealand dollar which is taking the bigger hit so far this week, sending AUD/NZD higher after the open. But when you compare the daily charts of AUD/USD and NZD/USD, they are pretty much the same trade.
The usually inverted correlation between the US dollar and Australian dollar is all but gone, with the dollar index providing little clues as to how the Aussie will trade. But we know that a strong risk on oil surrounding the Israel-Iran conflict is a risk-off move for the Australian dollar and Wall Street.

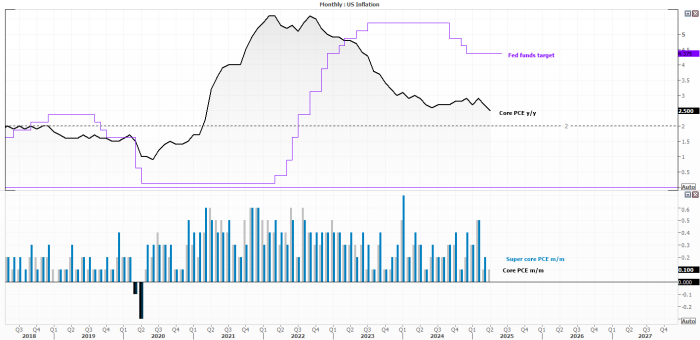
US PCE Inflation in Focus — But Middle East Tensions May Overshadow It
Headlines form the Middle East could easily take the limelight away from any economic release this week, and that includes US GDO (which is a final release anyway) and the monthly core PCE print. However, if Iran bide their time and don’t escalate things further ahead of PCE inflation, a soft print could see odds of a July cut rise from ~58%.
Core PCE slowed to a four-year low of 2.5%, and the closer it moves to that 2% target the better for dovish bets. And if we do somehow see a resolution between Iran and Israel, traders could refocus their attention on Fed policy with the growing expectations of a September cut.
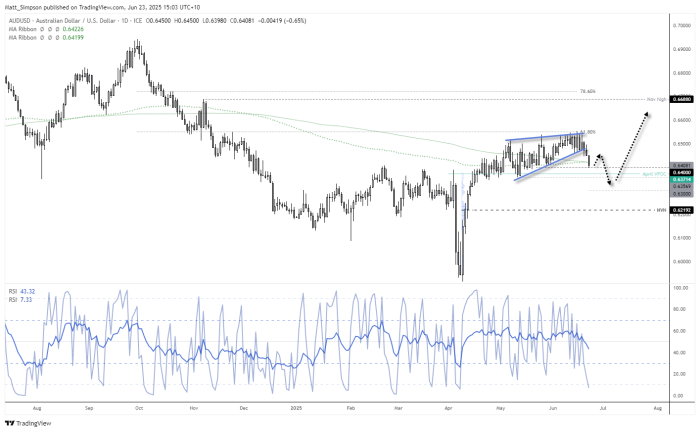
AUD/USD Technical Analysis
Bearish momentum has finally seen the downside break I have been touting for several weeks. A rising wedge pattern suggests a minimum downside target of 0.6370 (the wedge base), but with geopolitical tensions ratcheting up and momentum on my side, a move down to 63c could also be on the cards.
Note that prices are holding above 64c for now, and we could also see a near-term bounce back above the 200-day SMA and EMA before losses resume. But now AUD/USD has tipped its hand, traders could seek to fade into minor rallies to target the wedge low and 63c handle.
Further out, my bias is for AUD/USD to reach to new highs.