
AUD/USD climbed on Friday as US dollar weakness followed a soft Nonfarm Payrolls (NFP) report, with bulls now eyeing a breakout above the 0.66 handle. A weaker labour market, rising Fed cut bets, and firmer Australian data have underpinned sentiment, while this week’s US inflation releases could set the next leg for the pair.
View related analysis:
- AUD/USD Creeps Higher Post GDP, Resistance Hovers Nearby
- Australian CPI Data Supports RBA’s Cautious Approach on Rate Cuts
- Australian Dollar Outlook: Dip Buyers to Circle The Aussie
- AUD/JPY Dips to Support, Australian Full-Time Jobs Bounce
- AUD/USD Softens, ASX Hits Record as RBA Cuts and Lowers Cash Rate Projection
- AUD/USD, ASX 200 Outlook: Australia’s Consumers Rejoice Latest RBA Cut
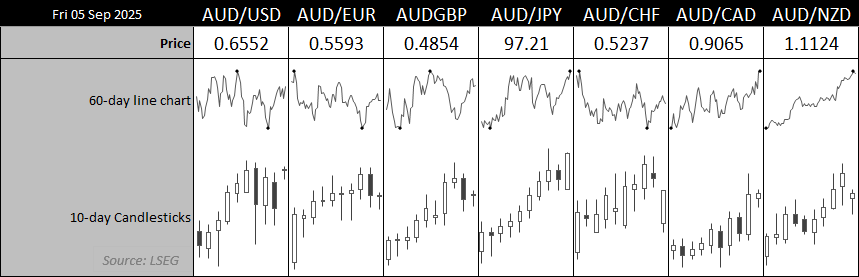
Chart Prepared by Matt Simpson, data source: London Stock Exchange Group (LSEG)
AUD/USD Weekly Outlook: Bulls Target 0.66 Breakout
The US dollar was the weakest major currency on Friday after a soft Nonfarm Payrolls (NFP) report boosted bets that the Fed could deliver three 25bp rate cuts by December. The headline jobs gain was just 22k, with manufacturing payrolls down 12k and services lower by 16k. The unemployment rate climbed to 4.3%, its highest since October 2021, while underemployment (U6) rose to 8.1%.
AUD/USD rallied as much as 1.1% to Friday’s high, with bulls now eyeing a breakout above the 0.66 handle. A move higher looks increasingly feasible as expectations for near-term RBA cuts fade. If this week’s US inflation report shows tariff effects on prices remain muted, further US dollar weakness could provide an additional tailwind for the Australian dollar.
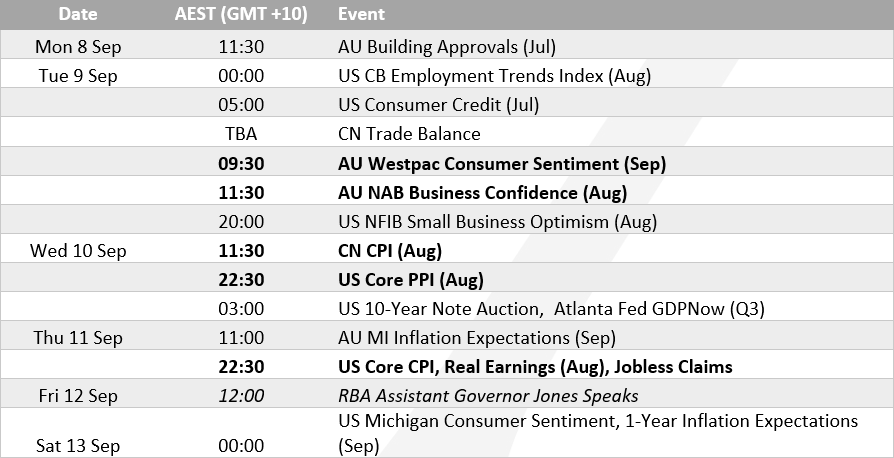
Chart Prepared by Matt Simpson, data source: Investing.com
Australian Business And Consumer Sentiment To Rise?
Business confidence rose to a near two-year high of 7 in July, according to the latest NAB survey — well above its long-term average of 5. A similar pattern looks likely in the upcoming Westpac consumer sentiment survey, with the previous report showing gains across all internal indices following the RBA’s most recent rate cut. Given the run of stronger data in recent weeks, I expect sentiment will continue to improve in this week’s release.
Domestic demand helped GDP beat expectations in Q2, and recent household spending data shows consumers are not holding back, particularly on services. Full-time employment also rebounded in the latest jobs report, while unemployment edged lower from already historically low levels — further underlining resilience in the economy. Which is why RBA cash rate futures imply just a 16% chance of a cut at their next meeting.
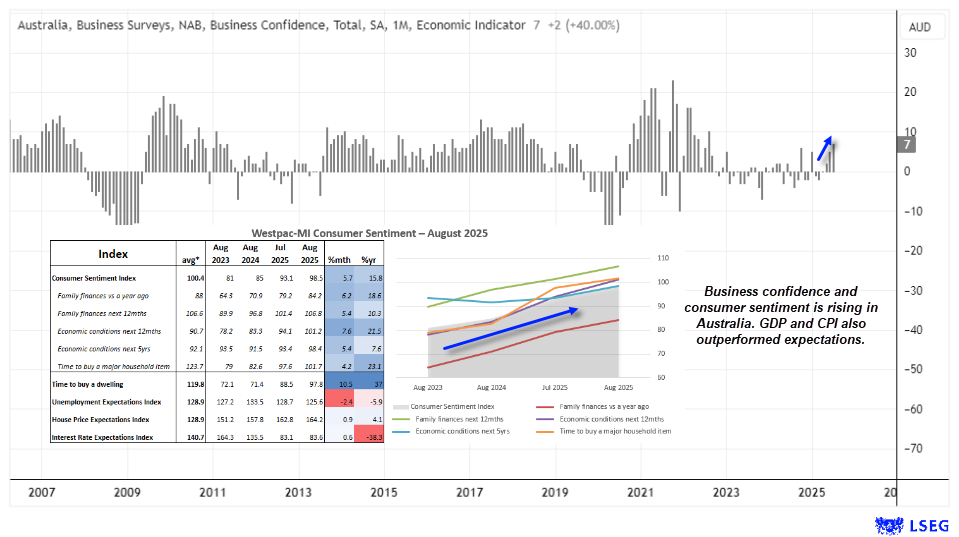
Chart Prepared by Matt Simpson, data source: Source: NAB, Westpac, LSEG.
US CPI and PPI in focus
Fed funds futures now fully price in a September Fed cut as a done deal, leaving incoming data to shape expectations for October and beyond. This week’s CPI and PPI reports will be critical, though both measures have been trending modestly higher. Recent Fed commentary suggests policymakers are less concerned about tariffs fuelling runaway inflation, which could give them scope to cut. Unless core CPI or PPI shows a sharp jump, markets are likely to put greater weight on labour market weakness when reassessing the Fed’s path. Naturally, flat or softer CPI reads will likely provide the green light for traders to short the US dollar on bets of back-to-back Fed cuts into the new year.
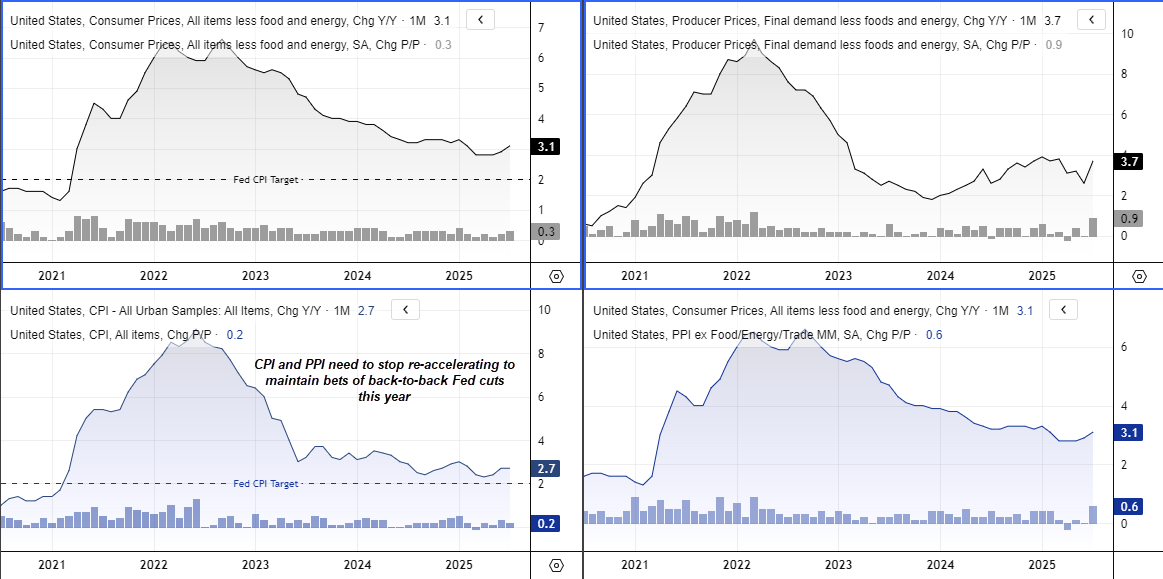
Chart Prepared by Matt Simpson, data source: Source: US Bureau of Statistics, LSEG
AUD/USD Correlations
The strong correlation between AUD/USD and NZD/USD is back in play over the 10 and 20-day time frames. Though it is interesting to note that the usually strong relationships with the US dollar and gold have become less reliable. While AUD/USD tends to track the Chinese yuan over the 20-day, its near-term 10-day correlation is now quite weak.
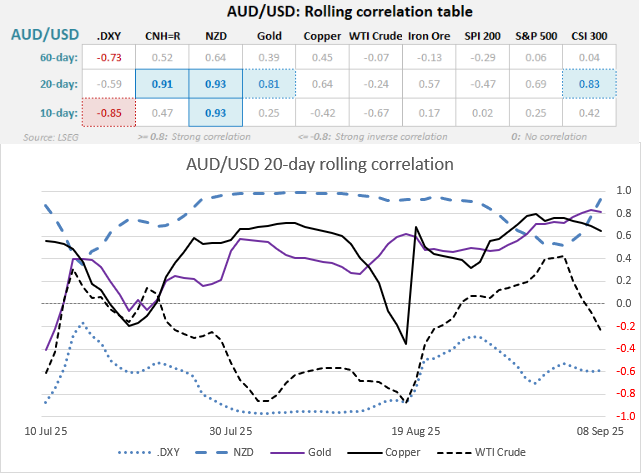
Chart Prepared by Matt Simpson, data source: Source: LSEG
AUD/USD Futures Positioning – COT Report
A significant round of short covering hit the Australian dollar futures market last week. Large speculators reduced gross-shorts by -16.9k contracts (-13.1%) — the fastest pace since March 2021. Asset managers cut gross-shorts by -14.9k contracts (-12.1%), bringing the combined reduction to -34.5k contracts. Net-short exposure fell by -17.9k contracts to a 4-week low of -82.6k among speculators, while asset managers trimmed -13k contracts, taking their net-shorts to a 3-week low of -66.1k.
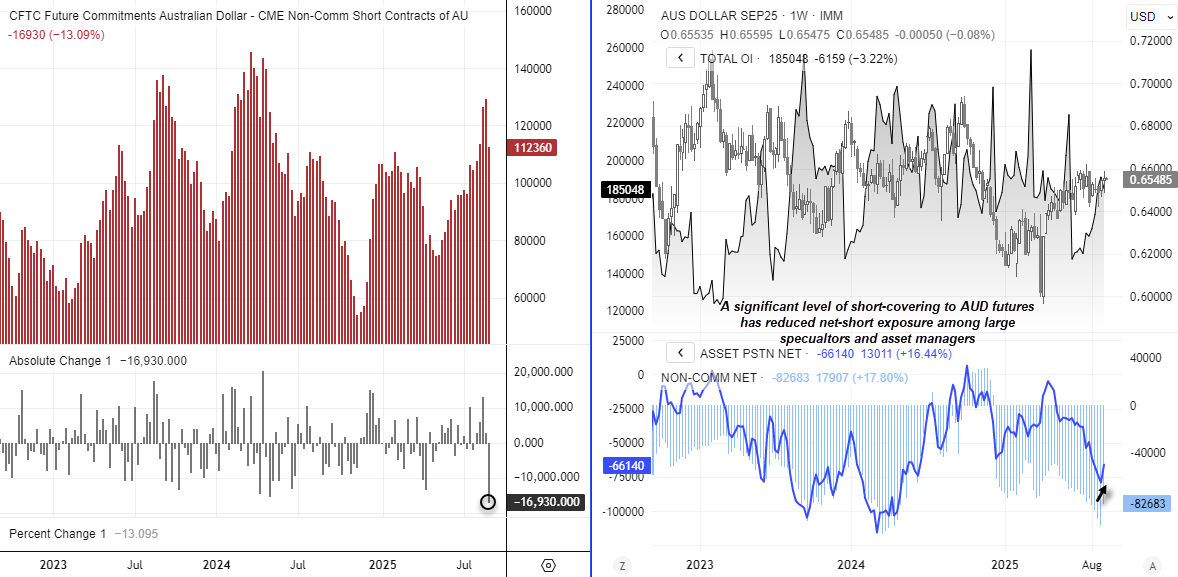
Chart analysis by Matt Simpson - data source: CME, LSEG
AUD/USD Technical Analysis
The battler has refused to roll over, with bulls stepping in each time bears attempted to force AUD/USD down to 64c. A double bottom formed around 0.6420 on the weekly chart, after which momentum shifted higher, with prices now using the 50- and 20-week EMAs as support over the past fortnight.
On the daily timeframe, the 20- and 50-day EMAs are also acting as support, creating a strong cluster for dip buyers. Friday’s bullish engulfing candle highlights a pickup in bullish momentum following a week of choppy sideways consolidation.
The bias remains for bulls to seek dips with a view to breaking above the 0.66 handle.
Traders should note the 200-week SMA and EMA at 0.6677, near the November high and the 0.67 handle, which mark the next key resistance zone for AUD/USD bulls.
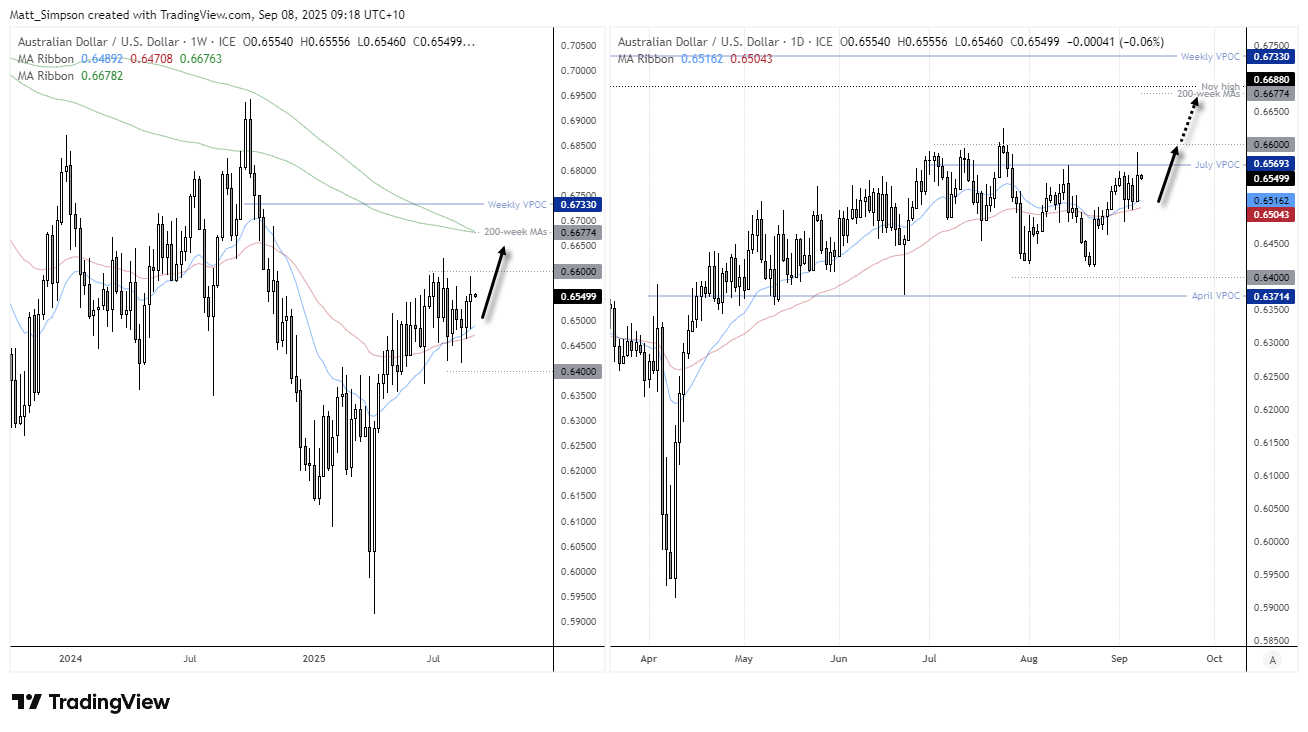
Chart analysis by Matt Simpson - data source: TradingView AUD/USD
View the full economic calendar
-- Written by Matt Simpson
Follow Matt on Twitter @cLeverEdge
How to trade with City Index
You can trade with City Index by following these four easy steps:
- Open an account, or log in if you’re already a customer
• Open an account in the UK
• Open an account in Australia
• Open an account in Singapore
- Search for the market you want to trade in our award-winning platform
- Choose your position and size, and your stop and limit levels
- Place the trade