
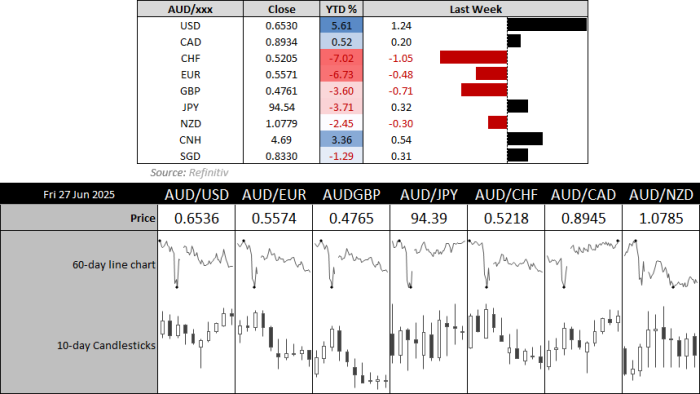
AUD/USD looks poised to break free from a stubborn two-month range as the US dollar continues to unravel. Australia's trimmed mean CPI dropped to a near four-year low, boosting expectations for a July rate cut from the RBA. Meanwhile, a slew of US economic data—ISM PMIs, PCE inflation, and nonfarm payrolls—will test the Fed’s resolve as signs of a slowdown mount. With sentiment tilting bullish despite net-short positioning, AUD/USD may soon target 66c or even 67c if resistance is cleared.
AUD/USD Breakout on Watch as RBA Rate Cut Looms and Fed Faces Data Test
- RBA rate cut likely in July after a sharper-than-expected fall in trimmed mean CPI to 2.4%, its lowest since 2020. This week’s retail sales is unlikely to derail a cut.
- US data in focus as ISM PMIs and nonfarm payrolls test the Fed’s resolve, with signs of economic slowdown increasing the odds of future rate cuts – even though Powell remains in denial and an apparent standoff with Trump
- AUD/USD sentiment shifts as large speculators increase net shorts to a 3-month high, while correlations with CNY and NZD remain supportive.
- Despite the bearish positionings a technical breakout looms for AUD/USD, with bullish engulfing weekly candle and upside targets near 66c and 67c if resistance is cleared.
View related analysis:
- AUD/USD Outlook: RBA Rate Cut Likely as Inflation Hits 3.5-Year Low
- AUD/JPY Risks Breakdown as Momentum Fades Below 95.00 Resistance
- AUD/USD Weekly Outlook: Aussie Slides as Oil Surges on Middle East Tensions
- Gold Rally Faces Resistance Heading Into July
RBA on Track for July Rate Cut as Inflation Cools Further
Australia’s latest inflation data likely seals the deal for a Reserve Bank of Australia (RBA) rate cut in July. The trimmed mean CPI – the RBA’s preferred inflation gauge – slowed to 2.4% year-on-year, marking a three-year, seven-month low. The -0.4 percentage point decline was the sharpest monthly drop in five months, while the weighted mean CPI fell to 2.1%, its lowest level since October. Meanwhile, CPI excluding travel and volatile items ticked back to 2.7%, reversing last month’s rise.
There’s no top-tier data due for Australia this week, but retail sales could be worth watching. A soft or below-expectation retail sales print would further support the case for easing. At this stage, the RBA may struggle to justify holding rates steady, making a July 8 rate cut the likely outcome.
US Economic Data and Fed Policy in Focus as Rate Cut Debate Heats Up
The bulk of this week’s market-moving data comes from the United States, with the spotlight on the ISM manufacturing and services PMIs and nonfarm payrolls (NFP). While Fed Chair Jerome Powell used his semi-annual testimony to push back on imminent rate cuts, he also cautioned that tariff-related inflation could show up in June or July's data.
Still, recent ISM prints suggest slowing momentum: the services PMI fell to 49.9 in May, and manufacturing dropped to 48.5, both in contraction territory. While these aren’t outright recessionary levels, they reinforce the view that the US economy is losing steam. In my view, the Federal Reserve may be holding rates unnecessarily high, responding to inflation risks that are not yet materialising — possibly even to counter political pressure from Trump.
Should the ‘prices paid’ components of the ISM data weaken, it could reignite speculation over Fed rate cuts, especially if Trump’s tariffs are seen as less inflationary than feared. That scenario could weigh on the US dollar (USD) and support the Australian dollar (AUD).

Economic Calendar Source: Refinitiv
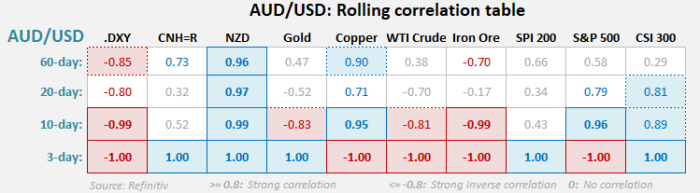
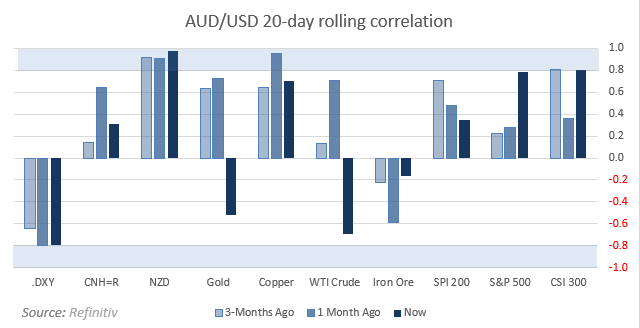
AUD/USD Correlations
The Australian dollar is displaying familiar relationships with the Chinese yuan and New Zealand dollar. The inverted correlation between the US dollar and AUD/USD has also return. But in reality, most markets are trading with or against the US dollar at present.
While the Israel-Iran conflict is not showing the upmost respect to their supposed ceasefire, traders seem satisfied that the US will not really be drawn into a major scale war, and that is allowing them to revert their attention to US data and its potential impact on Fed policy.
Source: Refinitiv
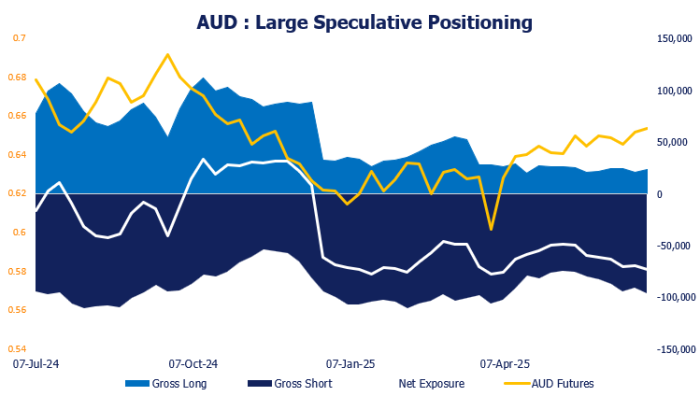
AUD/USD Futures – Market Positioning From The COT Report
- Large speculators increased their net-short exposure to AUD/USD futures by 3.2k contracts, to a 3-month high of 72.6k
- Gross-shorts rose 5.3k (+5.8%), gross long rose 2k contracts (+9.7%)
- Asset managers increased their net-short exposure by 4.9k contracts
- Gross longs rose by 3k contracts (4%), longs were trimmed by -1.9k contracts (-4.4%)
Source: CFTC, Refinitiv
AUD/USD Technical Analysis:
For the most part of the past two months, AUD/USD has been grinding away an upside range where break above the 0.655 – 0.6550 region were met with selloffs. This made it frustrating for breakout traders and predictable for countertrend trades.
But the game may have changed, and a breakout could be pending.
A bullish engulfing week formed despite a false break of 0.6400 on Monday, with its high-top low range spanning 3% (its most volatile week in 11).
A bullish pinbar perfectly respected the April VPOC to mark a prominent swing low and beginning of a 4-day rally. While Friday’s small bearish inside day shows a slightly hesitancy to continue higher, I suspect it is only matter of time before we see a bullish breakout, which could make dips preferable for bulls.
- Bulls could seek dips down to 64c
- A break above last week’s high brings the 66c handle into focus
- Also note the resistance cluster just above 67c (200-week SMA, 87.6% Fibonacci level and weekly VPOC) which could make a viable bullish target further out)
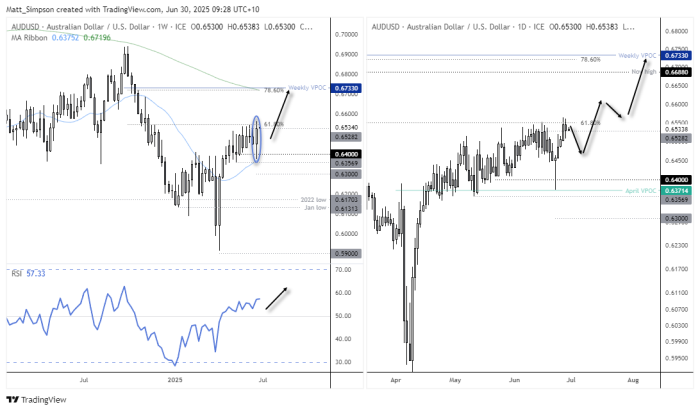
Source: TradingView / Matt Simpson