
The Australian dollar (AUD/USD) closed last week strongly as dip buyers stepped in, pushing the pair into a four-day rally and leaving a bullish engulfing weekly candle. With the RBA in no rush to cut, Australian inflation staying sticky, and the Fed preparing to ease policy, conditions are aligning for a potential breakout above the 0.66 handle. Futures positioning and correlations suggest AUD/USD could remain supported in a weak-USD environment, with bulls likely to buy into dips for another leg higher.
View related analysis:
- ASX 200 Outlook: Futures Signal Bearish Correction After 9000 Rejection
- Australian CPI Data Supports RBA’s Cautious Approach on Rate Cuts
- Gold Outlook: Triangle Patterns Face Resistance, Positioning Softens
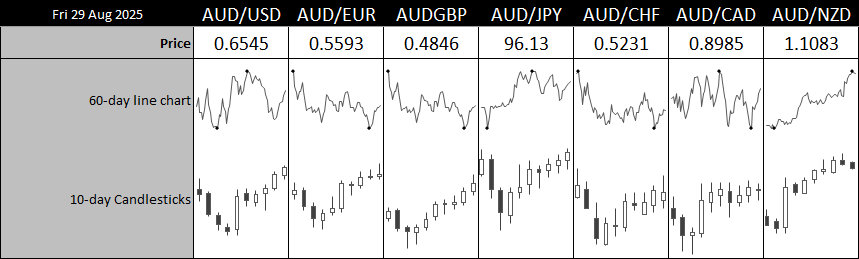
Chart analysis by Matt Simpson - data source: ABS, LSEG
AUD/USD Outlook: Bullish Breakout Risks Grow for the Australian Dollar
RBA To Remain Cautious On The Outlook
Wednesday’s GDP report is expected to show sluggish growth in Q2, with Westpac forecasting the annualised rate for 2025 to slow to 1.3% — well below the RBA’s 1.8% forecast. With employment the only metric still showing resilience, it’s hard to see how growth figures could deliver any meaningful upside surprise.

Chart analysis by Matt Simpson - data source: ABS, LSEG
Australia’s inflation figures came in higher across the board. While many were quick to point to the temporary spike in electricity prices as the main driver, I don’t see anything in the broader dataset to justify RBA cuts any time soon. Rents and fuel also pushed higher, and the only faint sign of disinflation was in transportation.
Private new capital expenditure for Q2 underwhelmed at 0.2% q/q versus 0.8% expected. However, Westpac noted that its spending plan estimate for this financial year is 3.1% higher than last year’s. Construction work rose 3% in the June quarter, largely driven by mining, though it is still up 4.8% y/y. The Australian economy may not be running hot, but it’s not in the gutter either. Again, this suggests the RBA will stay on hold into Q4 at a minimum.
Fed Remain On Track For September Cut
Fed funds futures continue to point to a September cut from the Fed despite core PCE inflation rising to 2.9% y/y. On Friday, FOMC member Daly said it will “soon be time to recalibrate policy.” Odds of another 25bp cut in October or December sit just below 50%, with expectations tapering off the further out we look.

Chart analysis by Matt Simpson - data source: ISM, LSEG
Incoming US data will shape whether another cut is delivered this year, with NFP and ISM reports the main events to watch. With services prices paid trending higher and manufacturing prices still elevated, even a slight dip lower could bolster bets of an October–December cut and provide further support for AUD/USD.
The same goes for Friday’s Nonfarm Payrolls report. Employment growth has been trending lower for three years, so any further weakness — or a rise in unemployment — could see traders betting on a follow-up cut beyond September.
Chart analysis by Matt Simpson - data source: Investing.com
AUD/USD Correlations
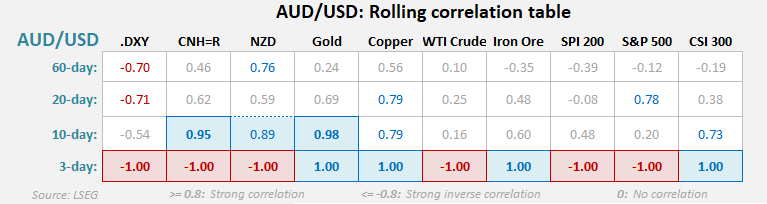
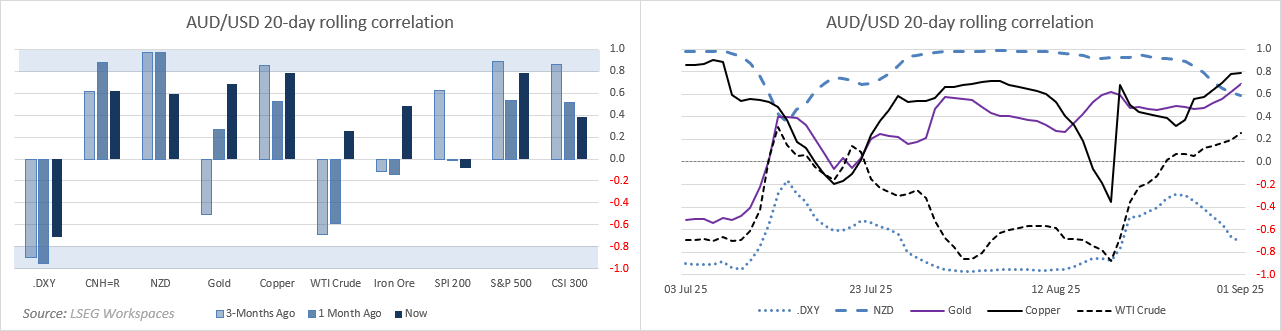
Chart analysis by Matt Simpson - data source: LSEG
AUD/USD Futures Positioning - COT Report
- Net-short exposure to AUD/USD futures continued to rise last week, with bearish exposure reaching their highest levels since April 2014.
- Both sets of traders increased gross-short exposure and decreased gross-longs.
- Yet The Australian dollar continued to rise into the weekly close thanks to the weaker US dollar.
- I suspect AUD/USD is likely to remain supported in the current weak-USD environment, and the odds of a bullish breakout are on the rise.
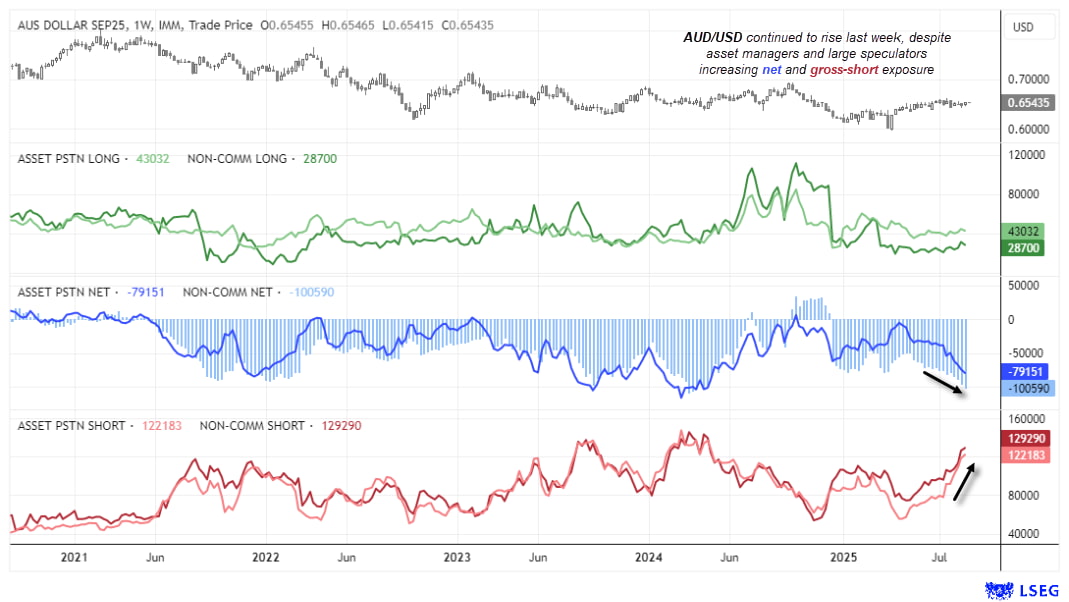
Chart analysis by Matt Simpson - data source: CME, IMM, LSEG
AUD/USD Technical Analysis
Australian dollar dip buyers were seemingly rewarded last week. The 50-week EMA held perfectly for Wednesday’s low before the week closed with a 4-day winning streak and a bullish engulfing weekly candle. The 20-week EMA is above the 50-week, and both averages are pointing higher. AUD/USD appears to have the hallmarks of a market that is about to extend its rally.
So my core theme remains the same as last week’s: bulls are likely on standby for dips, eyeing a run towards – and potential breakout above – the 66c handle.
Note the July VPOC and weekly R1 pivot around the 0.6587 high, a break above which brings the 66c handle into focus for bulls.
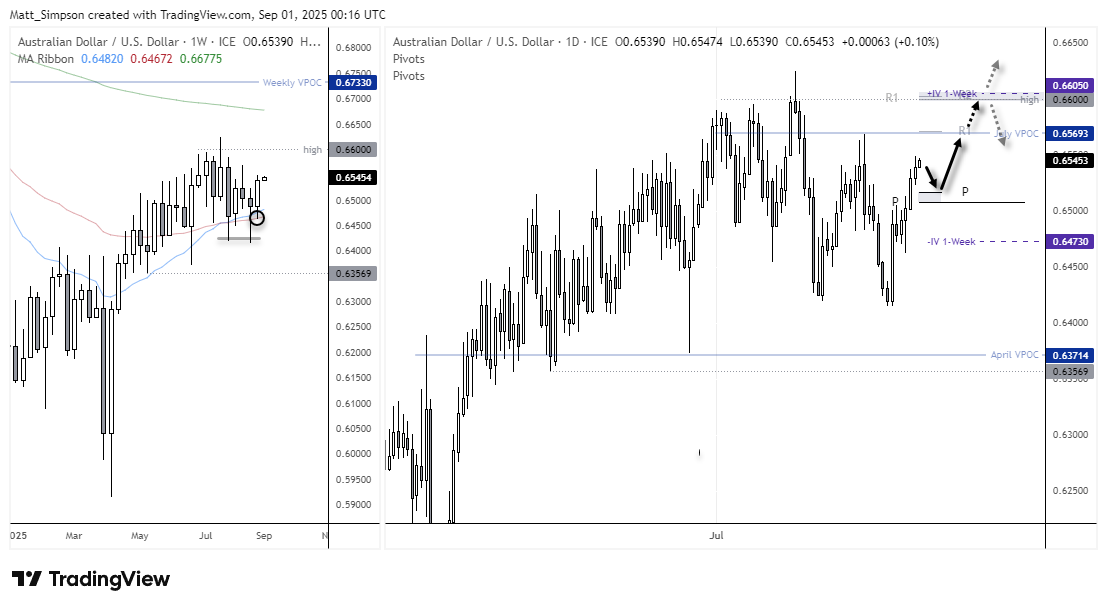
Chart analysis by Matt Simpson - data source: TradingView AUD/USD
View the full economic calendar
-- Written by Matt Simpson
Follow Matt on Twitter @cLeverEdge
How to trade with City Index
You can trade with City Index by following these four easy steps:
- Open an account, or log in if you’re already a customer
• Open an account in the UK
• Open an account in Australia
• Open an account in Singapore
- Search for the market you want to trade in our award-winning platform
- Choose your position and size, and your stop and limit levels
- Place the trade