
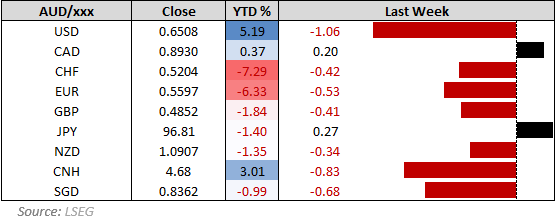
The Australian dollar was the weakest major currency last week, weighed down by renewed RBA rate cut bets following a soft labour market report. Unemployment rose by 0.2 percentage points to 4.3%, and 38,000 full-time jobs were lost in June. While not recessionary (yet), the data reinforces earlier warnings of a slowing economy, including weak business and consumer sentiment, sluggish growth, and softer monthly inflation prints.
The Reserve Bank of Australia (RBA) held rates steady at its last meeting—likely awaiting the Q2 CPI data due on July 30. But at this stage, it’s difficult to see how the upcoming inflation report would not justify an August rate cut. Money markets have even begun entertaining the possibility of a 50bp cut, despite the RBA’s historically cautious approach.

Charts prepared by matt Simpson - Data Source: London Stock Exchange Group (LSEG)
View related analysis:
- US Dollar Rally at Risk as Fed's Waller Fuels Dovish Pivot Speculation
- AUD/USD Slumps, ASX Hits Record as RBA Rate Cut Bets Rise After Soft Jobs Data
- AUD/USD weekly outlook: US CPI and Aussie Jobs in Focus
RBA Minutes Released On Tuesday
If anything can be gleaned from the RBA’s meeting minutes, it’s just how close they came to cutting rates—despite ultimately deciding to hold. And the closer they were to pulling the trigger, the higher the odds not just of an August rate cut, but potentially their first 50 basis point move this cycle.
New Zealand CPI Softer in Q2
New Zealand’s inflation data came in soft, rising 0.5% q/q in the second quarter, down from 0.9% and below 0.6% expected. The annual rate slowed to 2.8% y/y, below 2.8% expected but above 2.5% in Q1. Given Australia’s inflation tends to track New Zealand’s, it could be seen as another sigh for the RBA to ease rates.
RBA Bullock To Speak on Thursday
The RBA governor, Michelle Bullock, speaks at the Anikia Foundation on Thursday. It could be an opportunity for the RBA to confirm expectations of a cut, though knowing the overlay cautious approach of the RBA, I wouldn’t be too surprised if little is said on policy and they leave it for the quarterly CPI report next week to decide.

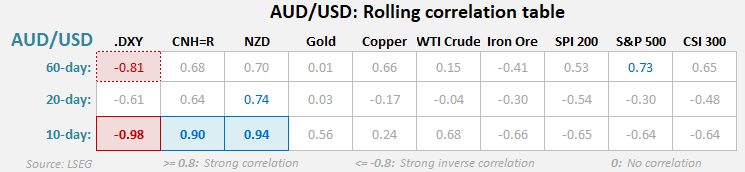
AUD/USD Correlations
• While the correlation matrix offers a useful snapshot of overall relationships, it is backward-looking and doesn’t fully explain short-term price moves.
• Much of the strong positive correlation between AUD/USD, NZD/USD, and CNH/USD can be attributed to their shared exposure to the US dollar.
• Despite its typical correlation with the New Zealand dollar, AUD/NZD had been trending higher—until Australia’s June employment report triggered fresh RBA rate cut bets, sending the pair lower over the past three sessions.
• Meanwhile, previous correlations between AUD/USD and commodities such as gold, copper, and WTI crude oil have recently weakened, suggesting a shift in market drivers.
Charts prepared by matt Simpson - Data Source: London Stock Exchange Group (LSEG)
AUD/USD Technical Analysis
Well, buying the dips clearly didn’t work out for bulls last week. AUD/USD snapped a 3-week winning streak with a bearish engulfing candle—its most bearish weekly close since testing the 0.6000 handle back on 31 March. Over the past three weeks, we’ve now seen a shooting star, inverted hammer, and bearish engulfing pattern, all forming below the 0.6600 level—strongly suggesting a swing high may be in place.
Bears may look to fade minor rallies while AUD/USD remains capped below 0.6600, with the 0.6400 handle and the April VPOC (0.6371) as potential downside targets.

View the full economic calendar
-- Written by Matt Simpson
Follow Matt on Twitter @cLeverEdge
How to trade with City Index
You can trade with City Index by following these four easy steps:
- Open an account, or log in if you’re already a customer
• Open an account in the UK
• Open an account in Australia
• Open an account in Singapore
- Search for the market you want to trade in our award-winning platform
- Choose your position and size, and your stop and limit levels
- Place the trade