


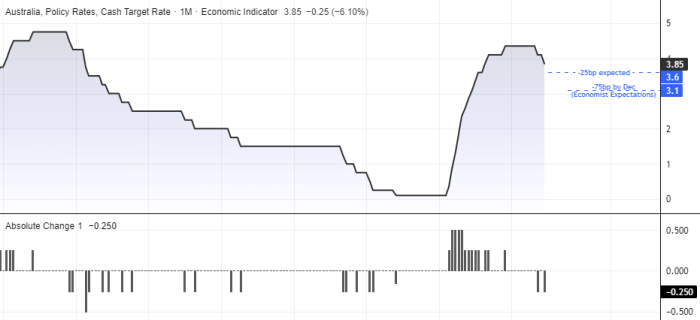
AUD/USD is under pressure for a third straight day as renewed US tariff threats weigh on risk sentiment. With a quiet US calendar due to Independence Day and June CPI not scheduled until next week, focus shifts to the RBA. A 25bp cut to 3.6% is widely expected, but with markets pricing in further easing, the tone of the statement could have a bigger impact on AUD/USD direction in the days ahead.
View related analysis:
- AUD/USD H2 Outlook: Can the Australian Dollar Keep Rebounding?
- AUD/USD Outlook: RBA Rate Cut Likely as Inflation Hits 3.5-Year Low
- AUD/USD Weekly Outlook: Bullish Breakout Pending?
Australian Dollar Slips Ahead of RBA Decision Amid US Tariff and Holiday Lull
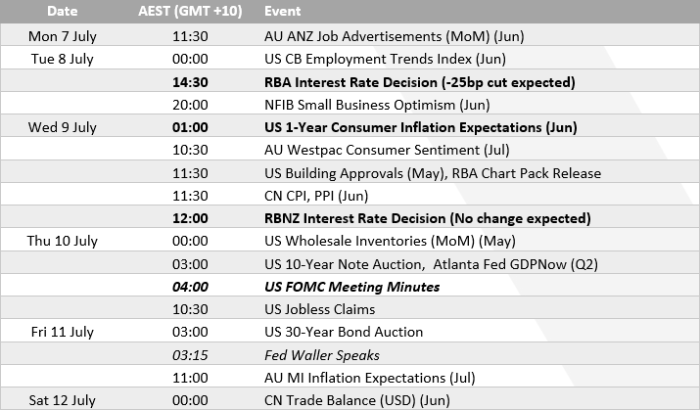
US Independence Day celebrations usually extend through to the Monday for much of the US, meaning many take a four-day weekend. That could make for a quiet start to the week for traders. It’s also not a big week for US economic data, with June CPI figures not due until next Tuesday.
So, while the FOMC minutes and US inflation expectations are worth monitoring, I do not anticipate either to be game-changers where Fed policy is concerned.
The Australian dollar is trading lower for a third day on renewed tariff concerns. US Treasury Secretary Scott Bessent warned on Sunday that tariffs will return unless trade deals are made by August 1. While Australia’s 10% tariff is not ideal, it is also not likely to hinder the economy too much. But it serves as a reminder that AUD/USD can be directed by Trump’s trade war.
RBA Expected to Cut Rates as Market Bets on Further Easing
And that brings us nicely to tomorrow’s RBA meeting. A 25bp cut to 3.6% seems highly likely, given Australia’s inflation has slowed to a 3.5-year low and Q1 growth was sluggish at 0.2%. There’s a decent chance the RBA will strike a cautious tone—given their well-known propensity to remain “cautious about the outlook”. But with economists favouring an end-of-year cash rate of 3.1% (allowing for a further two cuts) and market pricing suggesting around four cuts, the RBA are likely aware that expectations for further easing are intensifying. I’m just not convinced they’ll unveil a roadmap for three or four cuts at tomorrow’s meeting, though they may strike a slightly dovish tone to keep such expectations alive.
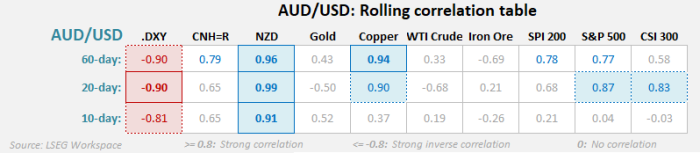
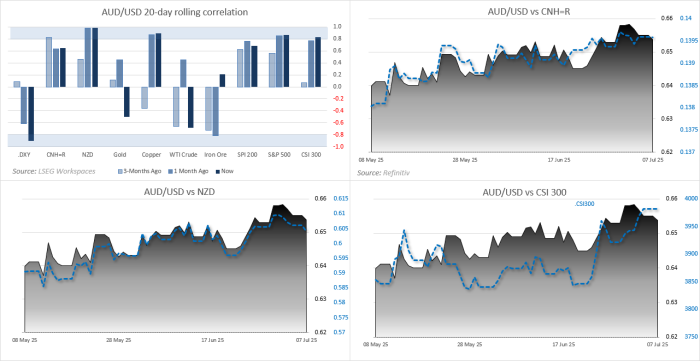
AUD/USD Correlations
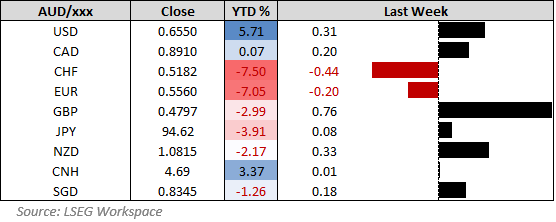
Australian dollar correlations largely stem from the anti-US dollar trade. The inverse relationship between AUD/USD and the US Dollar Index (DXY) remains strong across 10, 20 and 60-day lookbacks. And the positive correlation with NZD/USD remains very strong across all timeframes (and all above 0.9).
Though it is interesting to see the Australian dollar’s 10-day correlation break down on copper and China’s CSI 300 compared to last week, and commodities in general with gold and WTI crude oil seemingly doing their own thing.

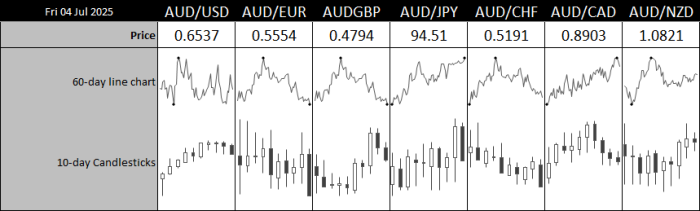
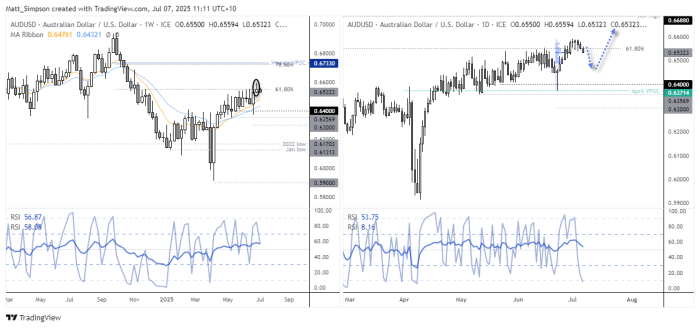
AUD/USD Technical Analysis
While the Australian dollar reached an 8-month high last week, there are signs that it may not be ready to fully extend its rally. A shooting star candle formed on the weekly chart, with the high-to-low range shrinking to half that of the prior week. AUD/USD also closed on the 61.8% Fibonacci retracement level, once again highlighting hesitation around the 0.6550 area. A bearish divergence continues to build on the weekly RSI (2), adding further caution for bulls.
On the daily chart, momentum appears to be turning lower. Bears may look to fade rallies within the prior two-day range, assuming AUD/USD is not yet ready to break above last week’s high. A dovish surprise from the RBA could support a move below 0.6500.
View the full economic calendar
-- Written by Matt Simpson
Follow Matt on Twitter @cLeverEdge
How to trade with City Index
You can trade with City Index by following these four easy steps:
- Open an account, or log in if you’re already a customer
• Open an account in the UK
• Open an account in Australia
• Open an account in Singapore
- Search for the market you want to trade in our award-winning platform
- Choose your position and size, and your stop and limit levels
- Place the trade


