
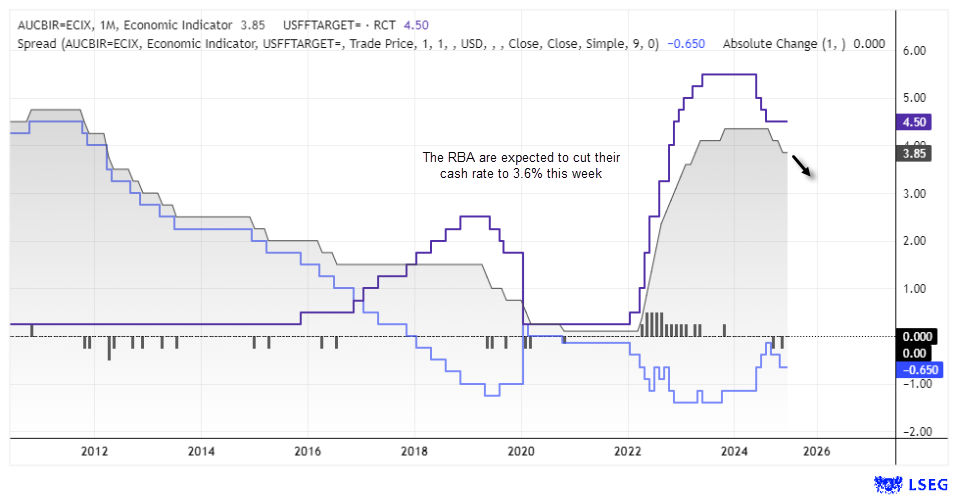
- RBA expected to cut by 25bp tomorrow
- US CPI is the main US economic data point, though retail sales and consumer sentiment warrant a look
- Seeking evidence of a swing high on the AUD/USD daily chart for a retest of the 200-day EMA
The Australian dollar is steady ahead of Tuesday’s Reserve Bank of Australia (RBA) meeting, where markets widely expect a 25bp cut to 3.6%. While the move has been well-flagged, traders will be watching the tone of the Statement on Monetary Policy for clues on whether another cut could follow later this year. With US CPI due just hours after the RBA decision, volatility for AUD/USD is expected – of which I’m seeking evidence of a swing high on the daily chart.
View related analysis:
- USD/JPY, GBP/JPY Outlook: Trump Eyes Fed Shakeup, BOE Rattle Pound Bears
- USD Selloff Stabilises Amid Mixed ISM, Trump’s Fed Pick
- AUD/USD Weekly Outlook: Fed Bets Boost Aussie as US Data Weakens
AUD/USD Steady Ahead of RBA Cut, US CPI Looms Large
RBA Set for a Cautious 25bp Cut
The RBA is poised to trim the cash rate by 25bp to 3.6% on Tuesday. Headline CPI has eased to 2.1% y/y, comfortably within the RBA’s 2–3% target, while unemployment has risen to 4.3%. Despite this, the Bank is unlikely to deliver an overtly dovish cut.
RBA cash rate futures are pricing a 51% chance of a larger 50bp move — a scenario that seems unlikely given the Bank’s gradualist approach. The updated Statement on Monetary Policy is expected to keep medium-term inflation forecasts unchanged at 2.6%, reinforcing a measured policy path.
All considered, I expect a cautious 25bp cut on Tuesday, with the Bank keeping any dovish enthusiasm firmly in check.

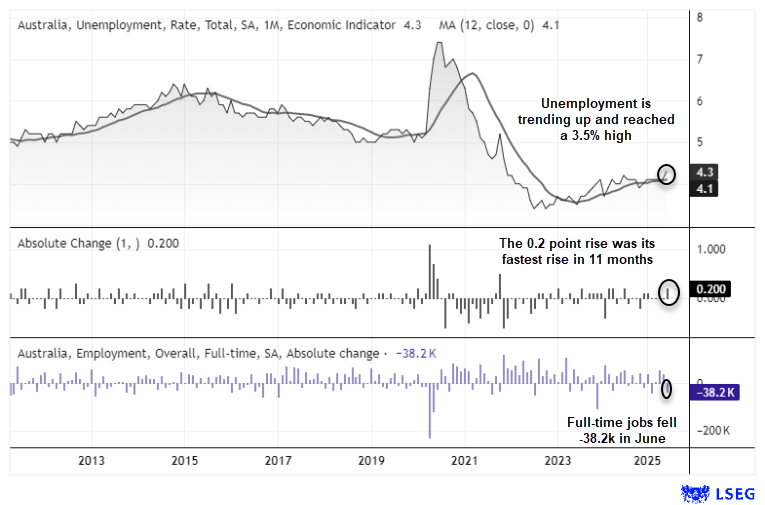
Australian Wages and Jobs in Focus Post-RBA
The wage price index (WPI) on Wednesday and Thursday’s employment report follow the RBA decision. A cautious cut paired with weak jobs data could strengthen the dovish case for another move in October or December. With full-time employment already down by 38.2k and unemployment at a 3.5-year high, AUD bears will be watching for fresh downside catalysts.
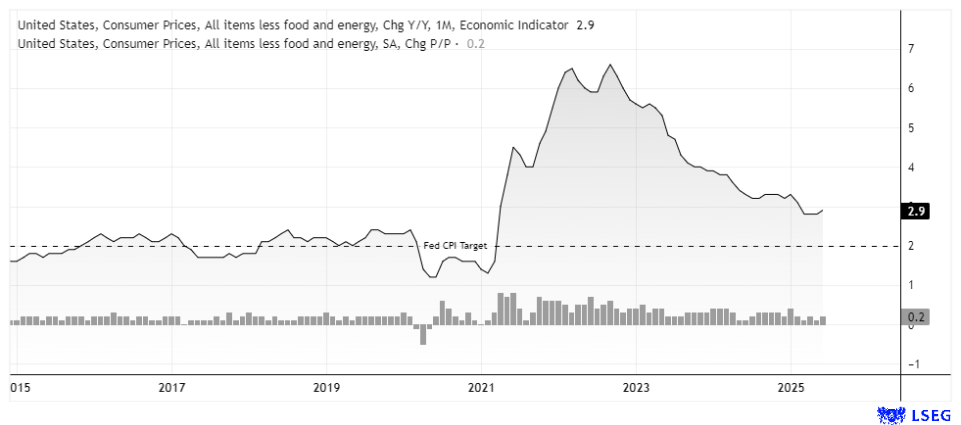
US CPI – The Main Event for USD Traders
US CPI on Tuesday could be the deciding factor for September Fed policy. Core CPI rose 0.2% m/m in June to 2.9% y/y, but a print at 3% or higher could undermine expectations for an imminent cut. Such a surprise would likely boost the US dollar and weigh on AUD/USD, especially given the pair’s strong negative correlation with the DXY (-0.86 over the past 10 days).

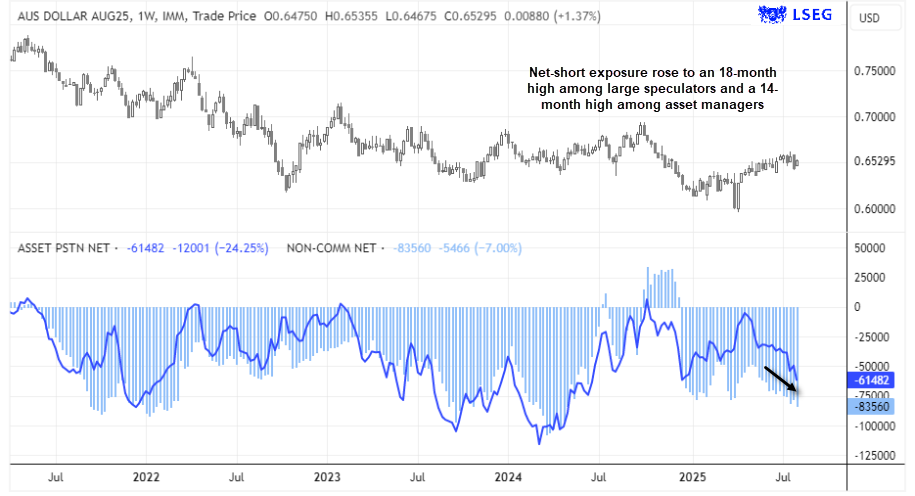
COT Positioning – AUD/USD Futures
CFTC data shows net-short AUD/USD positions have climbed to multi-month highs, with large speculators and asset managers both heavily short. The recent bearish outside week suggests sellers are in control — but if AUD/USD holds firm post-RBA, short covering could trigger a rally towards 0.66.
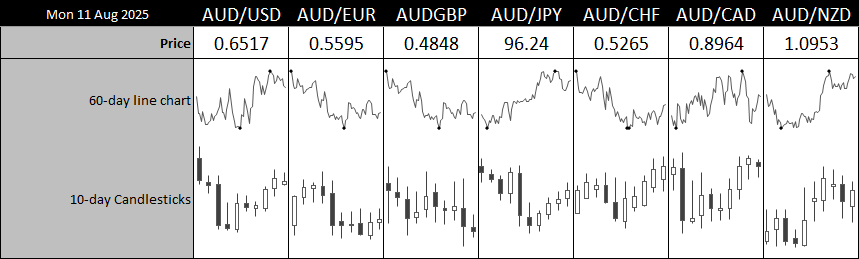
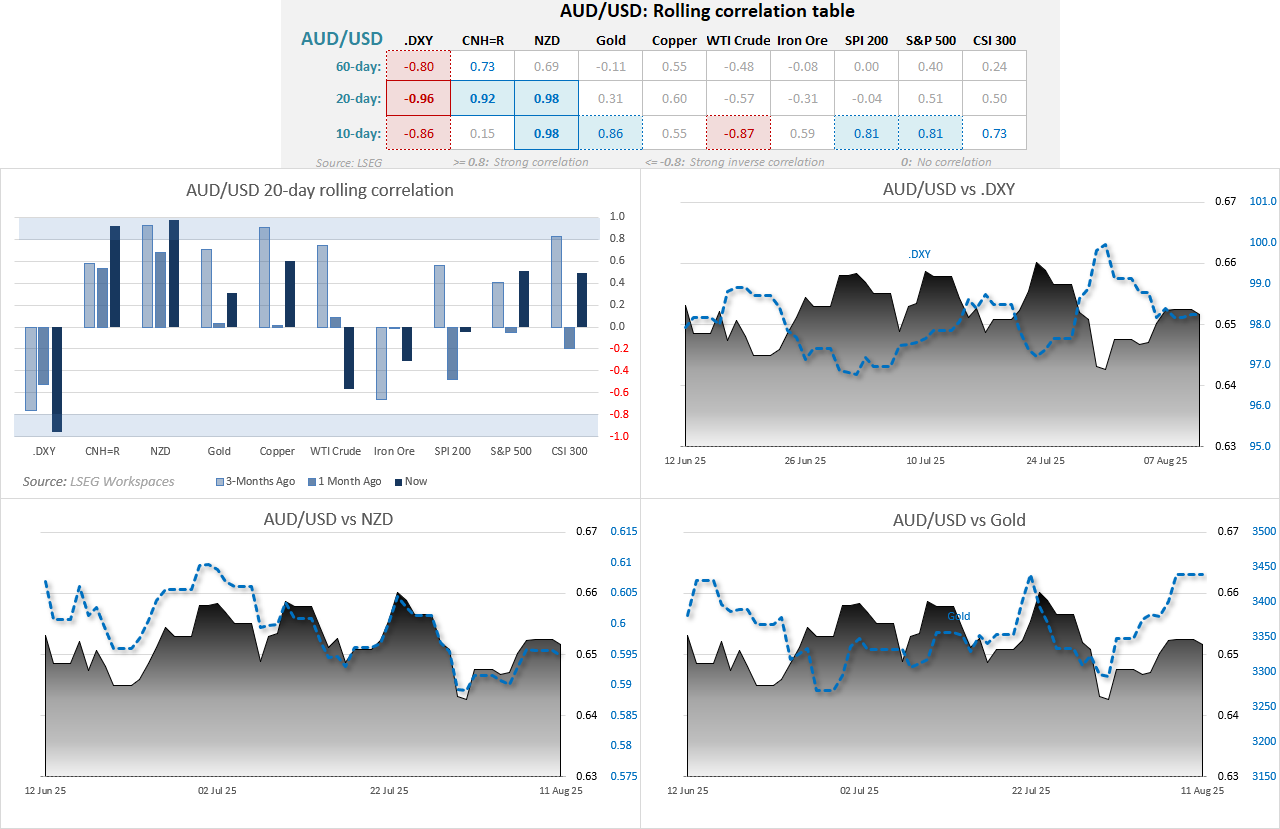
AUD/USD Correlations:
The Australian dollar has held its strongest correlation with the New Zealand dollar over the past 10- and 20-day periods. Tomorrow’s RBA meeting could provide the catalyst for a divergence between the two. While the 10-day inverted correlation between AUD/USD and the USD Index has eased slightly, it remains strong at -0.86.
The 10-day correlation between the Aussie and the Chinese yuan (CNH) has collapsed over the past fortnight, although it remains strong over the 20-day lookback and generally firm over the 60-day. A rebound in that shorter-term correlation over the coming week wouldn’t be surprising.
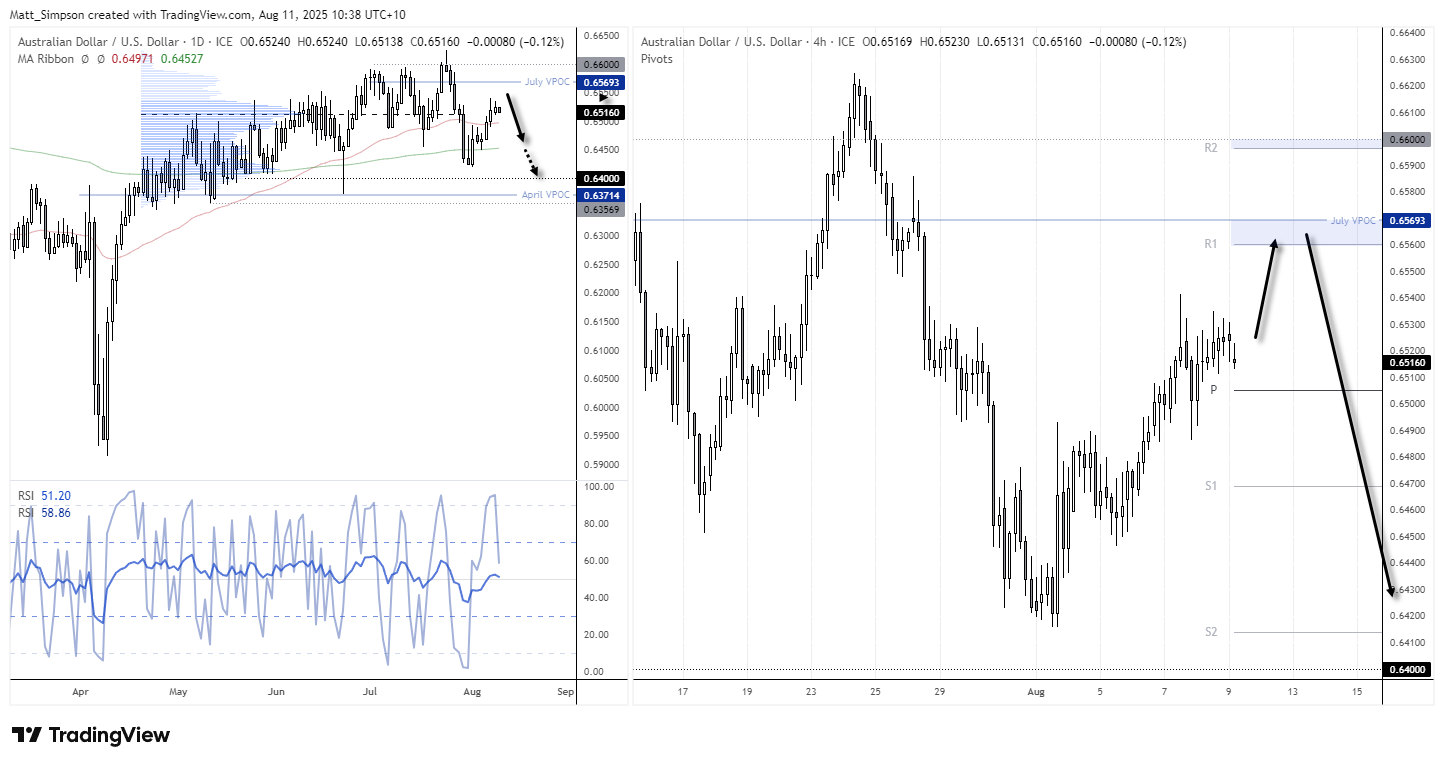
AUD/USD Technical Outlook
AUD/USD has risen nearly 2% from its recent cycle low, but resistance looms near 0.6560 (weekly R1) and 0.6593 (July VPOC). The weekly chart’s bearish engulfing pattern points to a potential swing high forming, with bears targeting a retest of the 200-day EMA at 0.6452.
For bulls to take control, the RBA would need to surprise by holding rates or delivering a cut without dovish guidance, while US CPI would have to come in soft enough to reinforce expectations of another Fed cut this year.
View the full economic calendar
-- Written by Matt Simpson
Follow Matt on Twitter @cLeverEdge
How to trade with City Index
You can trade with City Index by following these four easy steps:
- Open an account, or log in if you’re already a customer
• Open an account in the UK
• Open an account in Australia
• Open an account in Singapore
- Search for the market you want to trade in our award-winning platform
- Choose your position and size, and your stop and limit levels
- Place the trade
![]()