


It’s been a while since I was on the wrong side of an RBA decision, but last week they decided to hold the cash rate at 3.85% instead of delivering the 25bp cut I had envisaged. They likely want to wait for the quarterly CPI figures on 30 July, which I suspect will be soft enough to justify a rate cut—something the monthly inflation figures have already hinted at.
But given the typically cautious tone struck by the RBA in their statement, I doubt they’ll deliver much of a dovish cut anyway. That will keep traders guessing as to whether they really will deliver another two rate cuts in the second half. Personally, I wouldn’t be surprised if they only deliver another 50bp of cuts this year, taking the cash rate down to 3.35%. And if a third were to arrive, perhaps they’ll opt for a 15bp move to bring the cash rate back in line with the traditional quarter-point scale.
View related analysis:
- NZD/USD and AUD/NZD Analysis: RBNZ Holds Rates, Technical Levels in Focus
- US Dollar and Canadian Dollar Under Pressure as Japanese Yen Attracts Flows
- Australian Dollar Broadly Higher, AUD/JPY Eyes Breakout as RBA Holds Rates
- AUD/USD Weekly outlook: RBA Poised To Cut by 25bp

Chart prepared by Matt Simpson, source: LSEG
Australian Employment Report in Focus as RBA Doves Await Cracks
Australia’s robust employment situation has of course been a supporting feature behind the RBA’s higher cash rate. The unemployment rate remained at a healthy 4.1% in May, though the participation rate may have topped in recent months. 41.2k part-time jobs were lost in May (fastest decline in 14 months) was effectively offset the 38.7k full-time rise, making the -2.5k loss of jobs a minor issue. Still, should we see the cracks widen it allows room for RBA doves to breath. June employment figures therefore warrant a look on Thursday.

Chart prepared by Matt Simpson, source: LSEG
Key US Inflation Data Could Sway Fed’s September Rate Cut Odds
There’s no shortage of FOMC speakers this week, and markets have plenty of relevant data to digest. Fed Chair Jerome Powell recently suggested the inflationary impact of Trump’s tariffs could begin to emerge during the summer months — making June’s CPI release on Tuesday particularly important for the US dollar outlook.
If CPI data comes in softer than expected, and is accompanied by weaker retail sales and producer prices, traders may increase their bets on a September rate cut. Current pricing implies ~60% odds of a cut, but that could rise above 70% if inflation trends continue to moderate. It could also weigh on the US dollar as traders refocus their attention to Fed cuts, assuming Trump’s tariffs return to the rear-view mirror as deals are made.
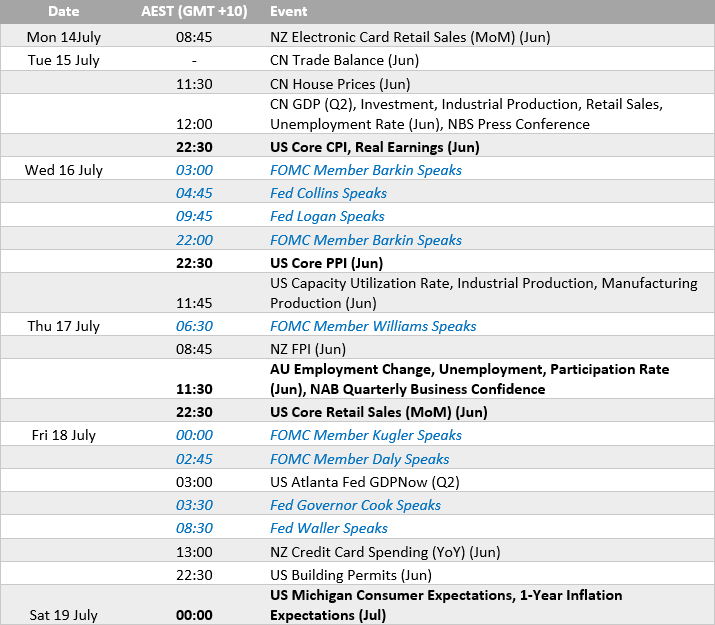
Chart prepared by Matt Simpson, source: LSEG
AUD/USD Correlations Suggest Bullish Bias, Unless Aussie Jobs Disappoint
Correlations between AUD/USD and usual suspects like NZD, CNY and DXY have weakened post-RBA, but the Aussie has held up. AUD/NZD surged 1.3% last week—the strongest since September—and AUD/USD booked a third straight weekly gain. Unless Thursday’s jobs data underwhelms, AUD/USD dips may be shallow and short-lived.
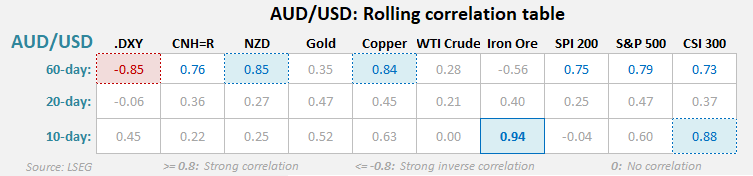
Chart prepared by Matt Simpson, source: LSEG
AUD/USD Futures: COT Report Shows Bears Add Shorts Ahead of Jobs Risk
• Net-short exposure by large speculators rose to a 15-week high of 74.3k contracts
• Asset managers’ net-short positions also hit a 15-week high at 38.2k contracts
• Gross-longs rose by 5k contracts while gross-shorts fell by -2.2k, showing mixed positioning bias
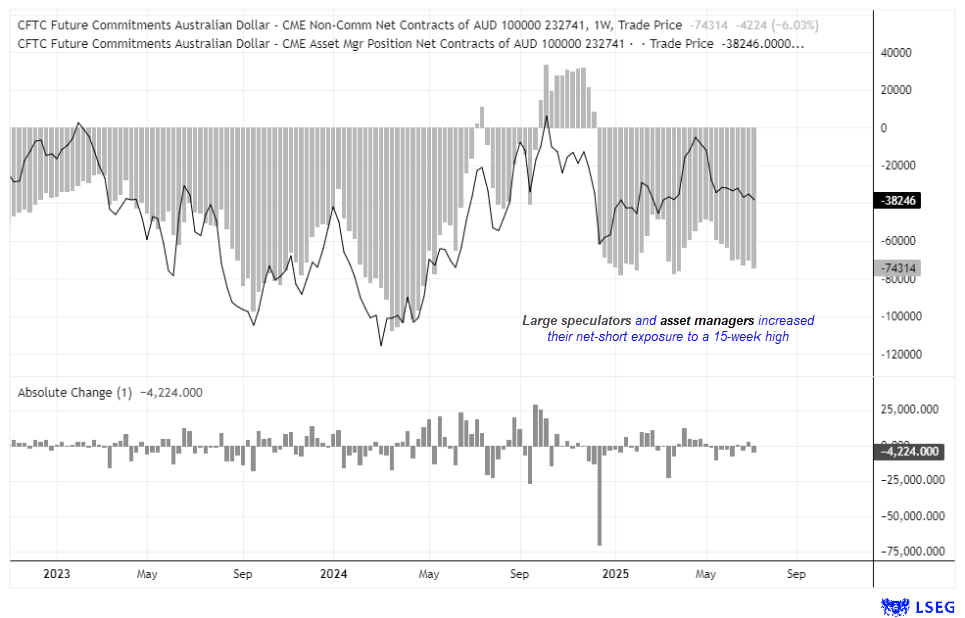
Chart prepared by Matt Simpson, source: LSEG
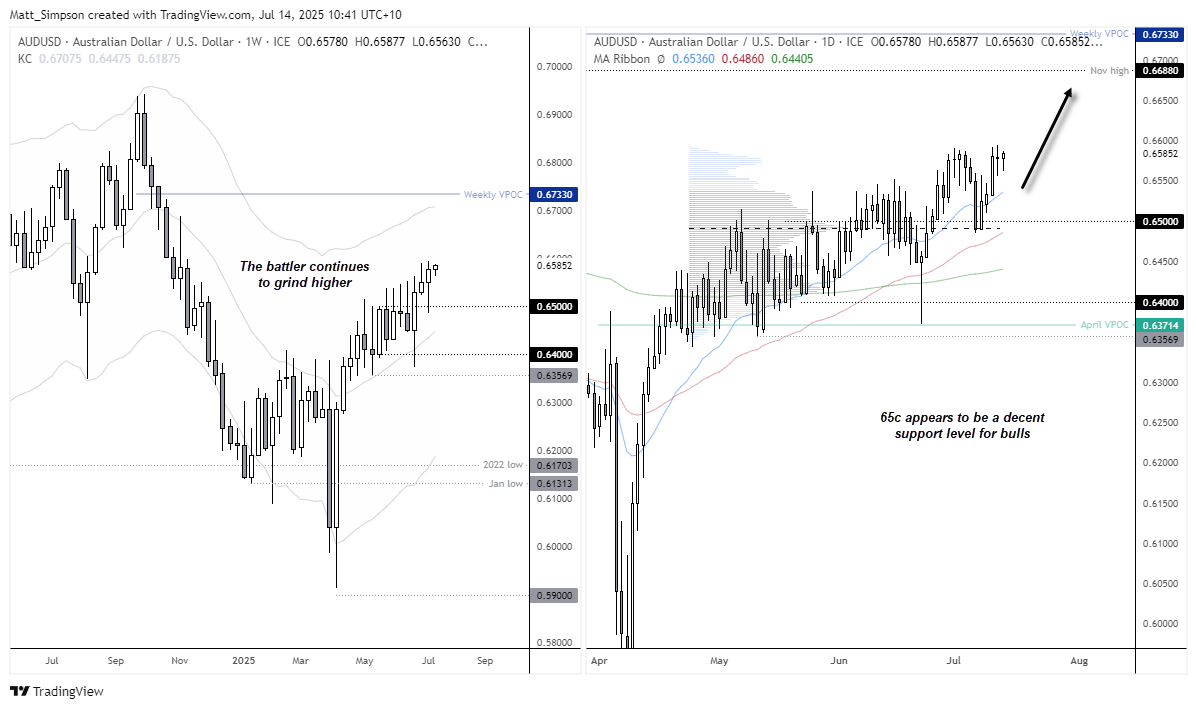
AUD/USD Technical Analysis: Bulls Defend 65c as Short-Sellers Get Squeezed
The Australian dollar has continued to grind higher for a third week, with bears being lulled into futile shorts before prices whip higher once again. It seems that 65c is an important support area for bulls, given it sits near the high-volume node of the choppy rise since late April, and close to last week’s low.
Therefore, any dips towards 65c could entice fresh long bets—unless a compellingly bearish case arises for the ‘battler’. That seems unlikely from the RBA, but more plausible from the Fed.
Analysis by Matt Simpson, source: TradingView
View the full economic calendar
-- Written by Matt Simpson
Follow Matt on Twitter @cLeverEdge
How to trade with City Index
You can trade with City Index by following these four easy steps:
- Open an account, or log in if you’re already a customer
• Open an account in the UK
• Open an account in Australia
• Open an account in Singapore
- Search for the market you want to trade in our award-winning platform
- Choose your position and size, and your stop and limit levels
- Place the trade


