


The RBA surprised the consensus by holding their overnight cash rate at 3.85%. A 25bp was effectively priced in, with some calling for another 25bp in August. I sat somewhere in the middle by expecting a cautious cut today, though that clearly did not arrive.
Instead, the RBA said it “remains cautious about the outlook,” which at this stage simply sounds like they’re too scared to pull the trigger. My best guess is that the RBA likely want to wait for the official quarterly CPI figures on 30 July before committing to a cut. Still, I believe they could have taken the punt today, given the sluggish growth data and notably softer inflation figures in the latest monthly release.
Regardless, I’ve always viewed a hold in July as simply delaying a cut until August — and I see little reason to change that view, unless the quarterly CPI does the unlikely and surprises to the upside.
View related analysis:
- US Dollar Rallies as Tariff Tensions Rattle Markets and Risk Appetite
- AUD/USD Weekly outlook: RBA Poised To Cut by 25bp
- AUD/USD H2 Outlook: Can the Australian Dollar Keep Rebounding?
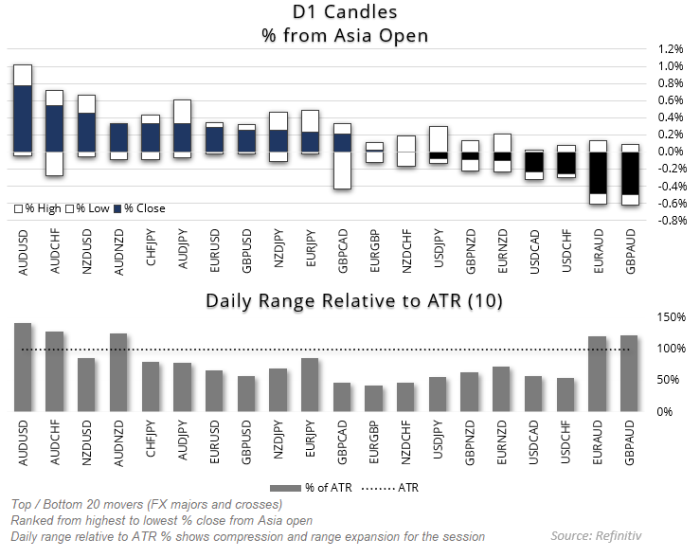
Chart prepared by Matt Simpson - data source: LSEG Workspace
AUD/JPY Breakout in Focus as RBA Surprises with Rate Hold
The Australian dollar spiked 0.7% (45 pips) within minutes of the RBA wrongfooting bears positioned for a cut. Yields are also higher on the assumption of the RBA holding rates “higher for longer”, which likely annuls the head and shoulders top on the 3-year yield daily chart. The ASX 200 futures market (SPI 200) also fell as much as 0.8% from the days high, though it has managed to recoup around a third of the days losses.

AUD/JPY Technical Analysis: Australian Dollar vs Japanese Yen
The Australian dollar has made notable ground against the Japanese yen since April, tracking Wall Street indices higher. AUD/JPY is up 0.8% today and now trades at a two-month high, appearing poised for a bullish breakout above the March high of 95.75.
The daily chart shows AUD/JPY using the 20-day EMA as dynamic support, with Monday’s spinning top doji marking the latest successful retest. A close around current levels would complete a three-bar bullish reversal pattern — a morning star formation.
On the 4-hour chart, prices have just reached the inverted head and shoulders (H&S) target. With the RSI (2) now overbought, a pullback may be due. Bulls could look for dips toward the 95.00 handle or the 94.75 region, in anticipation of a breakout toward the February VPOC at 96.43.
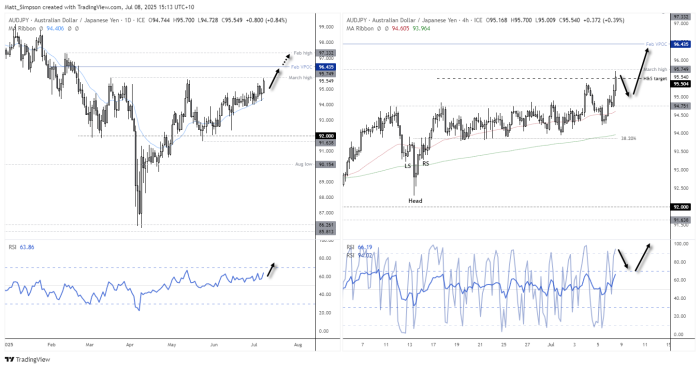
Chart analysis by Matt Simpson - data source: TradingView AUD/JPY
View the full economic calendar
-- Written by Matt Simpson
Follow Matt on Twitter @cLeverEdge
How to trade with City Index
You can trade with City Index by following these four easy steps:
- Open an account, or log in if you’re already a customer
• Open an account in the UK
• Open an account in Australia
• Open an account in Singapore
- Search for the market you want to trade in our award-winning platform
- Choose your position and size, and your stop and limit levels
- Place the trade


