


The combination of a stronger US dollar and an extended selloff on Wall Street on Monday put fresh pressure on the Australian dollar. I noted in yesterday’s report that correlations between AUD/USD, the Nasdaq and the US Dollar Index had re-emerged — and Monday certainly confirmed it.
The US Dollar Index regained bullish traction ahead of the return of US economic data this week. September’s nonfarm payrolls report is expected to land at an unspecified time, although it will be missing the unemployment rate. August data for construction spending, factory orders and international trade are also due.
Hawkish comments from Jerome Powell at the last FOMC meeting, alongside mixed views from other Fed officials, have traders on high alert for stronger-than-expected economic prints and lower odds of Fed cuts — lifting the US Dollar Index to a three-day high to mark a prominent swing low on Thursday and rebound back above 99.
View related analysis:
- Australian Dollar Outlook: AUD/USD Steadies as Jobs Data Shifts RBA Odds
- ASX 200 Market Outlook: Tech Rout Deepens, Financials Slide, ANZ Reverses
- Swiss Franc Extends Dominance Against US dollar As Risk-Off Hits Wall Street
- ASX 200 Slides Further as Tech, Discretionary and Real Estate Crack

US Dollar Bulls Reclaim 200-Day Moving Averages
The USD index closed back above its 200-day SMA and 200-day EMA, hinting at a breakout from a correction and resumption of its uptrend from the September low. However, as outlined in prior articles, I am seeking the end of a wave C and resumption of a larger bearish move. We may have already seen that wave C at 100.215. Also note the August high and 100 handle as potential resistance levels for bears to regain control.
If bulls break the US dollar above the November high, it paves the way for a run for the 101 handle where the potential for the end of wave C can be revisited. Such a move would clearly spell trouble for AUD/USD.

Chart analysis by Matt Simpson - data source: TradingView U.S. Dollar Index Futures
Wall Street Extends Losses as Dow, Nasdaq and S&P 500 Slide
Dow Jones futures led Wall Street lower and fell for a third day, falling -1.4% on Monday or -3.7% since Thursday – its worst three-day run since April. Nasdaq 100 futures fell for a fifth day and printed its lowest daily close in over four weeks, with banks leading the way lower. The Nasdaq bank index fell to a 1-month low, though the index topped out last August. Nvidia (NVDA) release earnings on Wednesday after the close which could make a larger impact on the tech sector and Wall Street in general. S&P 500 futures also fell in line with its Wall Street peers, VIX futures rose to a 21-day high.
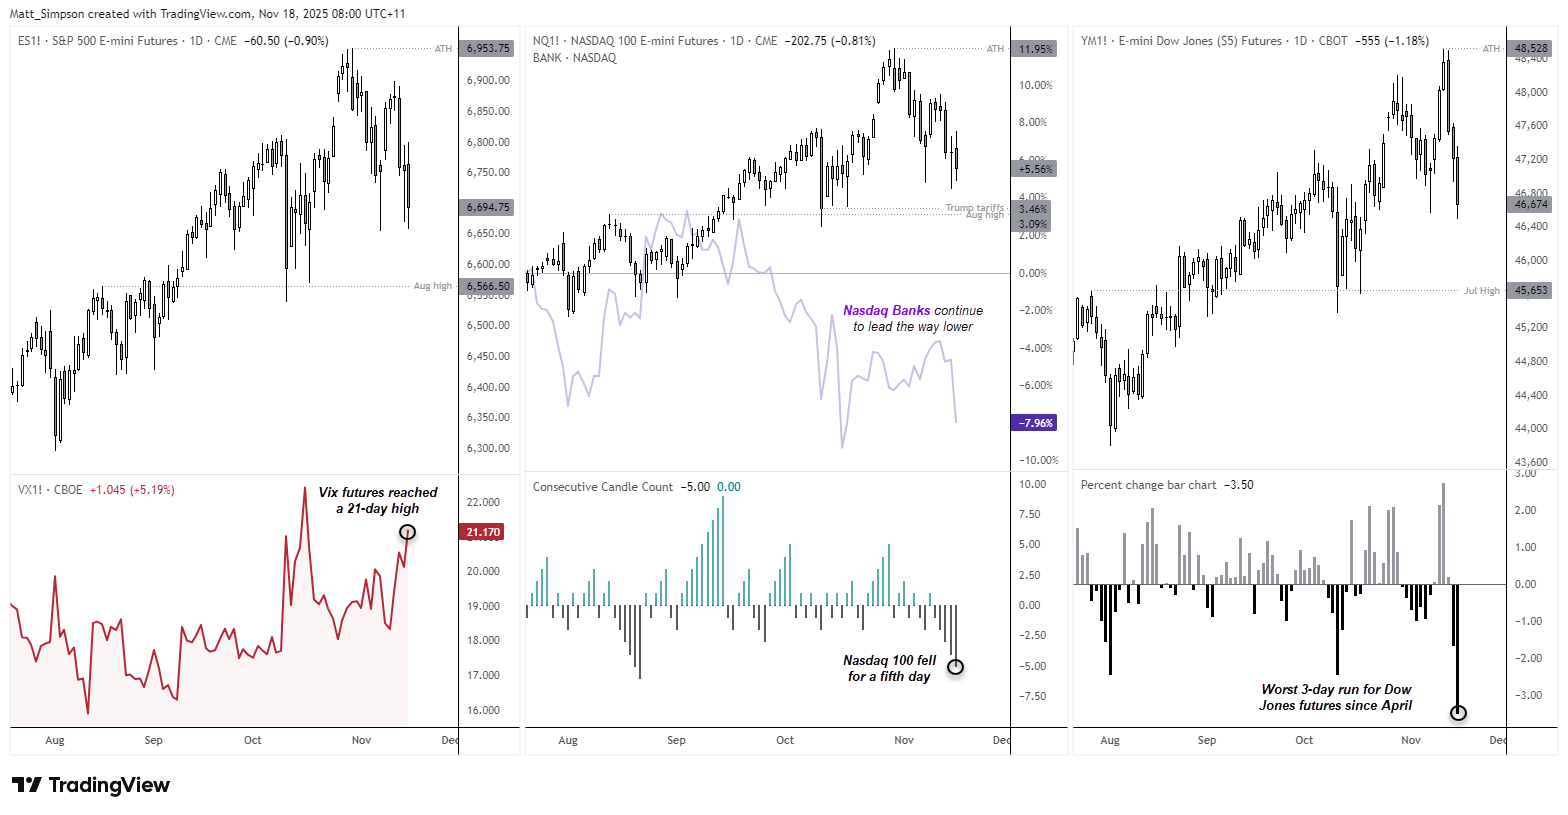
Chart analysis by Matt Simpson, Source: TradingView, CME E-mini Futures
With correlations between the US dollar, Wall Street and the Australian dollar remaining higher, AUD/USD traders should be on high alert for volatility.

AUD/USD Technical Analysis: Australian Dollar vs US Dollar
In yesterday’s weekly outlook I outlined my bias for a bullish week for AUD/USD and dips to remains shallow and likely to be bought. The Aussie’s -0.7% decline on Monday is already testing that outlook, and with a lack of domestic data its direction for the week firmly lies with sentiment towards the US dollar and Wall Street.
The 1-month implied volatility level for AUD/USD has risen to a 22-day high of 8.2% annualised. Risk reversals were a touch lower to show puts (bearish bets) were rising relative to calls (bullish bets) over the 1-week and 1-monnth timeframe. If sentiment continues to sour, risk reversals could fall alongside AUD/USD.

Chart analysis by Matt Simpson, Source: LSEG
The daily chart shows AUD/USD closing beneath its 200-day EMA (0.6497) after rolling over from its monthly pivot point (0.6537). The October close-low at 0.6469 is the next major support level for bears to target, although a confirmed break would likely require continued weakness on Wall Street and renewed strength in the US Dollar Index given the tight correlations.
A break beneath 0.6469 exposes the 200-day SMA (0.6454) and the 0.6440 swing low, which aligns with the monthly S1 pivot.
If bulls regain momentum, the 0.6520 resistance zone and the monthly pivot become the next logical upside targets. Whether those levels can break will depend largely on incoming US data and shifting Fed expectations.
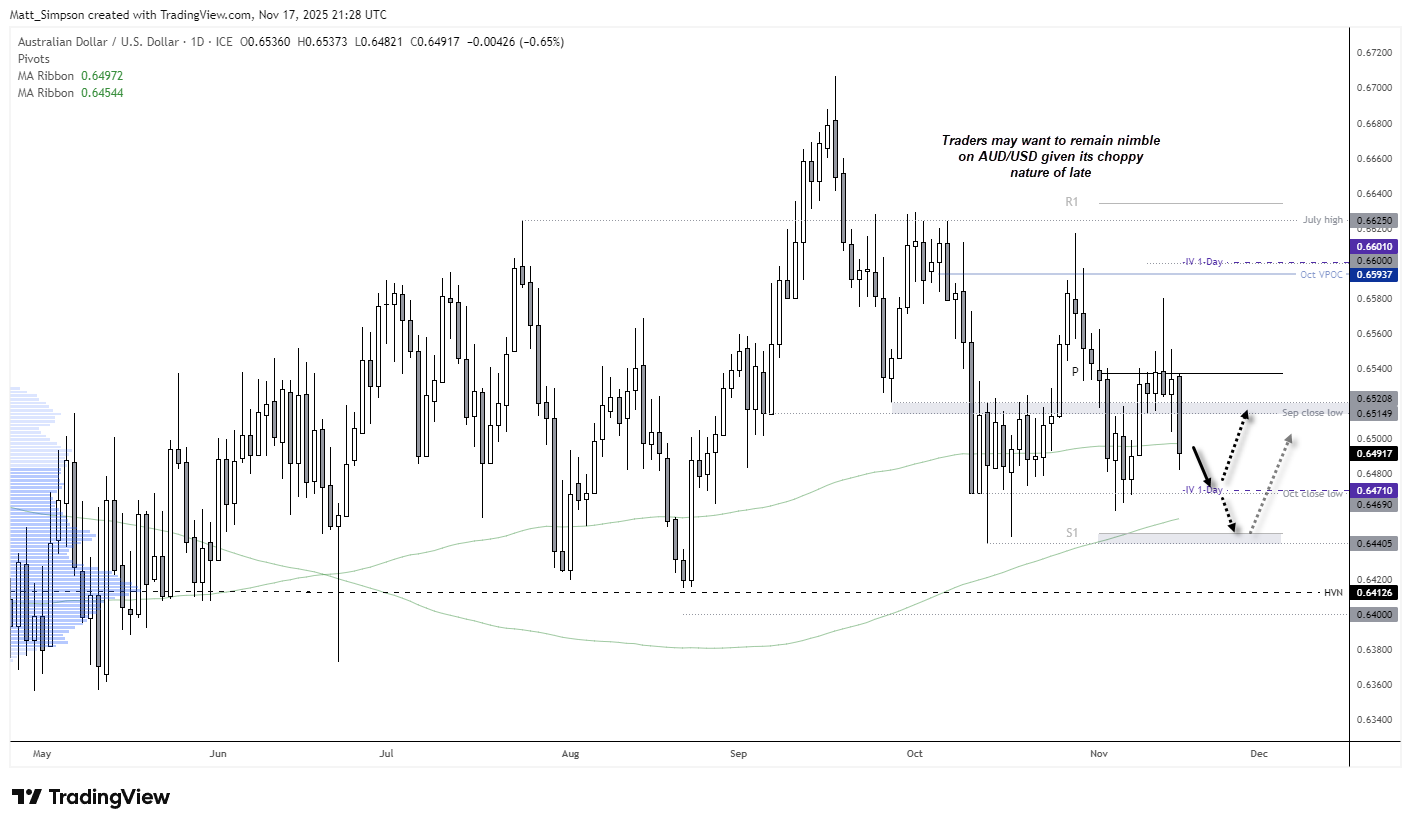
Chart analysis by Matt Simpson - source: TradingView AUD/USD
Economic Events in Focus (AEST / GMT+10)
Tuesday, November 18, 2025
11:30 AUD RBA Meeting Minutes (AUD/USD, AUD/JPY, ASX 200)
11:55 USD Fed Logan Speaks (S&P 500, Nasdaq 100, USD/JPY)
13:00 NZD RBNZ Offshore Holdings (Oct) (NZD/USD, AUD/NZD, NZD/JPY)
18:30 CHF Industrial Production (Q3) (USD/CHF, EUR/CHF, SMI)
19:40 EUR ECB Supervisory Board Member Tuominen Speaks (EUR/USD, EUR/GBP, DAX)
21:00 EUR ECB’s Elderson and German Buba Vice President Buch Speaks (EUR/USD, EUR/GBP, DAX)
23:00 CNY FDI (Oct) (USD/CNH, AUD/USD, Hang Seng Index)
23:00 NZD GlobalDairyTrade Price Index (NZD/USD, AUD/NZD, NZD/JPY)
23:00 USD Milk Auctions (S&P 500, Nasdaq 100, USD/JPY)
23:30 CAD New Motor Vehicle Sales (Sep) (USD/CAD, CAD/JPY, S&P/TSX)
Wednesday, November 19, 2025
00:00 GBP BoE MPC Member Pill Speaks (GBP/USD, EUR/GBP, FTSE 100)
00:00 USD Federal Budget Balance (Oct) (S&P 500, Nasdaq 100, USD/JPY)
00:15 USD ADP Employment Change (Weekly) (S&P 500, Nasdaq 100, USD/JPY)
00:15 CAD Housing Starts (Oct) (USD/CAD, CAD/JPY, S&P/TSX)
00:30 USD Import & Export Price Index (Sep) (S&P 500, Nasdaq 100, USD/JPY)
01:15 USD Industrial Production & Capacity Utilization (Oct) (S&P 500, Nasdaq 100, USD/JPY)
02:00 USD Factory & Durable Goods Orders (Aug) (S&P 500, Nasdaq 100, USD/JPY)
02:00 USD NAHB Housing Market Index (Nov) (S&P 500, Dow Jones, USD/JPY)
02:30 USD Fed Vice Chair for Supervision Barr Speaks (S&P 500, Nasdaq 100, USD/JPY)
03:00 USD FOMC Member Barkin Speaks (S&P 500, Nasdaq 100, USD/JPY)
View the full economic calendar
-- Written by Matt Simpson
Follow Matt on Twitter @cLeverEdge
How to trade with City Index
You can trade with City Index by following these four easy steps:
- Open an account, or log in if you’re already a customer
• Open an account in the UK
• Open an account in Australia
• Open an account in Singapore
- Search for the market you want to trade in our award-winning platform
- Choose your position and size, and your stop and limit levels
- Place the trade


