
The Australian dollar has gone nowhere fast this week, with AUD/USD trading almost exactly at its weekly open. Prices remain trapped between the 20- and 50-week EMAs, while the RSI (14) hovers near 50 — offering little in the way of directional clues.
View related analysis:
- Gold Suffers Fifth Worst-Day Drop in 55yrs As Momentum Trade Unwinds
- Canadian Dollar Price Action Setups Into CPI: USD/CAD, GBP/CAD, EUR/CAD
- Japanese Yen Price Action Setups: USD/JPY, EUR/JPY, AUD/JPY
- Australian Dollar Outlook: AUD/USD Bulls Reclaim 200-Day, US CPI Looms

Chart prepared by Matt Simpson - Source: LSEG
On the daily chart, AUD/USD is barely holding above the weekly pivot point. A bearish engulfing candle formed on Tuesday, and the pair’s open-to-close range has been limited to just 35 pips over the past seven sessions.
With no major local data due and a quiet global calendar, traders may need a fresh catalyst to spark volatility in either direction.
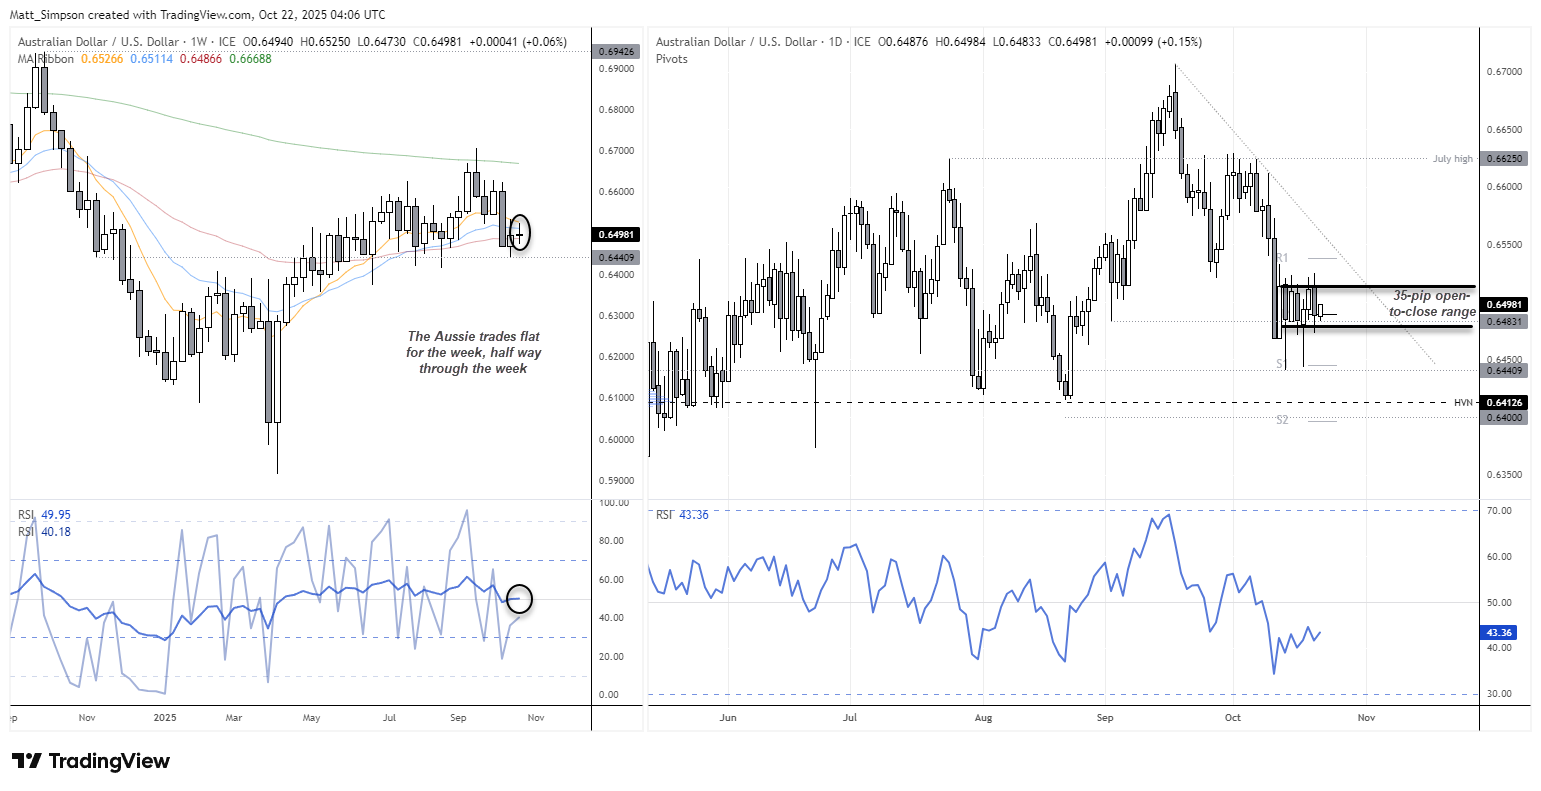
Chart analysis by Matt Simpson - Source: TradingView AUD/USD

AUD/USD Technical Analysis: Australian Dollar vs US Dollar
While a 35-pip range isn’t much, it at least defines clear levels for traders to fade highs or buy dips near support. Conveniently, the weekly S1 and R1 pivots align with the recent cycle lows and highs, reinforcing those boundaries.
The 1-hour chart shows AUD/USD trading slightly above the weekly pivot point (0.6489) after forming a higher low earlier today. If prices extend higher, bears could look to fade rallies toward 0.6525 or 0.6540 for tighter risk management.
The weekly pivot may serve as a near-term downside target for sellers, but a stronger bearish push could bring the weekly S1 (0.6445) into play.
Unless a new catalyst sparks volatility, range-trading strategies remain preferred for now.

Chart analysis by Matt Simpson - Source: TradingView AUD/USD

EUR/AUD Technical Analysis: Euro vs Australian Dollar
EUR/AUD remains trapped in a broad range, though the daily chart suggests potential for larger swings. The euro has effectively traded sideways against the Australian dollar since June, holding within a 500-pip band. Momentum has rolled over, and prices now sit just above the range midpoint.
While shorts are typically preferred closer to range highs, the recent reversal pattern is worth noting. A bearish hammer on Friday marked a false break of resistance, followed by a continued sell-off on Monday that pushed prices below the weekly pivot point. Tuesday’s inverted hammer and inside day paused the decline, but resistance held firm at the pivot level.
With prices now testing Tuesday’s low, a move toward the weekly S1 (1.7723) looks likely while the pair remains below that high. A decisive break under 1.7700 would expose 1.7600, near the range lows and the 61.8% Fibonacci retracement.
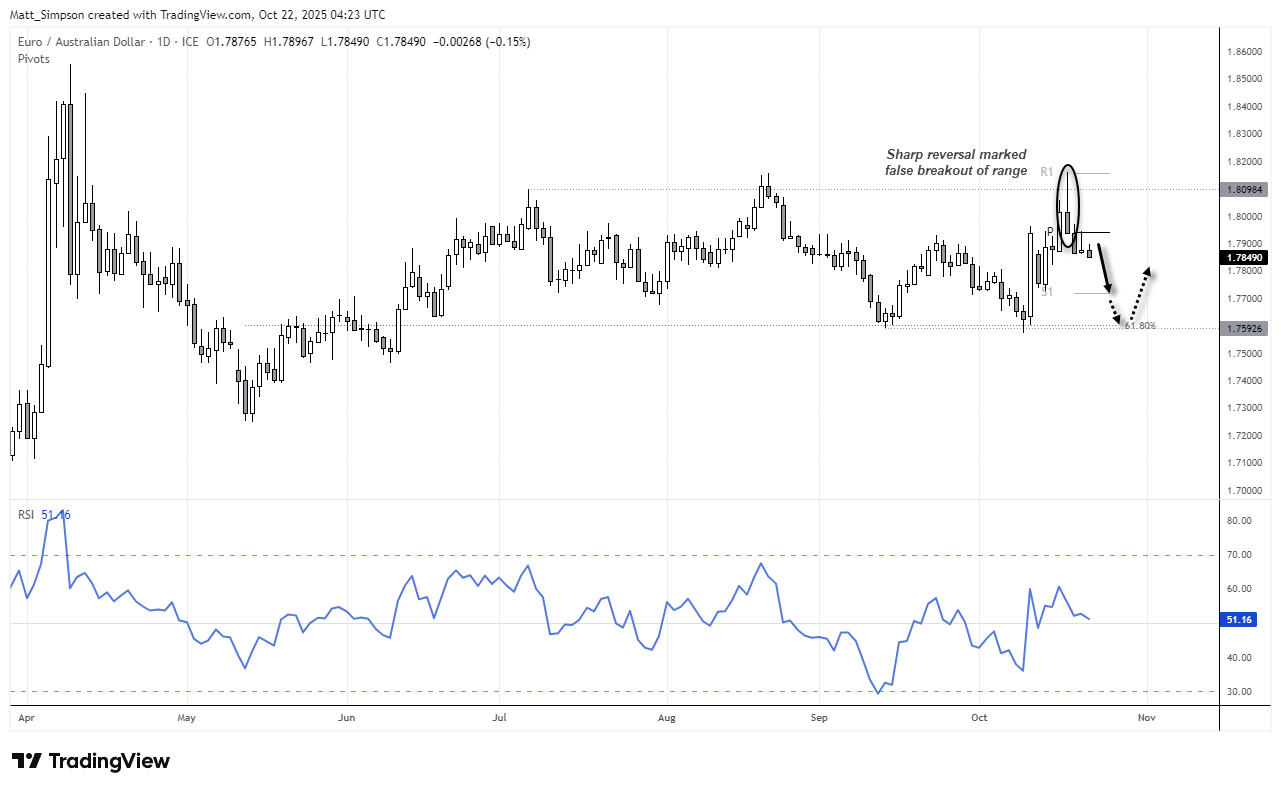
Chart analysis by Matt Simpson - Source: TradingView EUR/AUD
View the full economic calendar
-- Written by Matt Simpson
Follow Matt on Twitter @cLeverEdge
How to trade with City Index
You can trade with City Index by following these four easy steps:
- Open an account, or log in if you’re already a customer
• Open an account in the UK
• Open an account in Australia
• Open an account in Singapore
- Search for the market you want to trade in our award-winning platform
- Choose your position and size, and your stop and limit levels
- Place the trade