


Australia’s unemployment rate rose to a four-year high of 4.5% in September, according to the latest Labour Force report from the Australian Bureau of Statistics (ABS). While still low by historical standards (the long-term average sits at 6.54%) the trend is clearly rising.
Unemployment has been steadily climbing from its record low over the past two years, but the pace now appears to be increasing. September’s 0.2-percentage-point increase was the second such rise in four months. Over the past 11 months, the rate has risen four times, held steady four times, and fallen only once in November last year.
View related analysis:
- ASX 200 Morning Market Outlook: Fortescue Breakout, Materials Rally
- Japanese Yen Price Action Setups: AUD/JPY, GBP/JPY, USD/JPY
- Australian Dollar Outlook: AUD/USD Sentiment Sours Into RBA Mins, Jobs
- Bitcoin, S&P 500 Outlook: Wall Street Volatility Rattles BTC
Australian Dollar Weakens as Traders Price In RBA Rate Cut
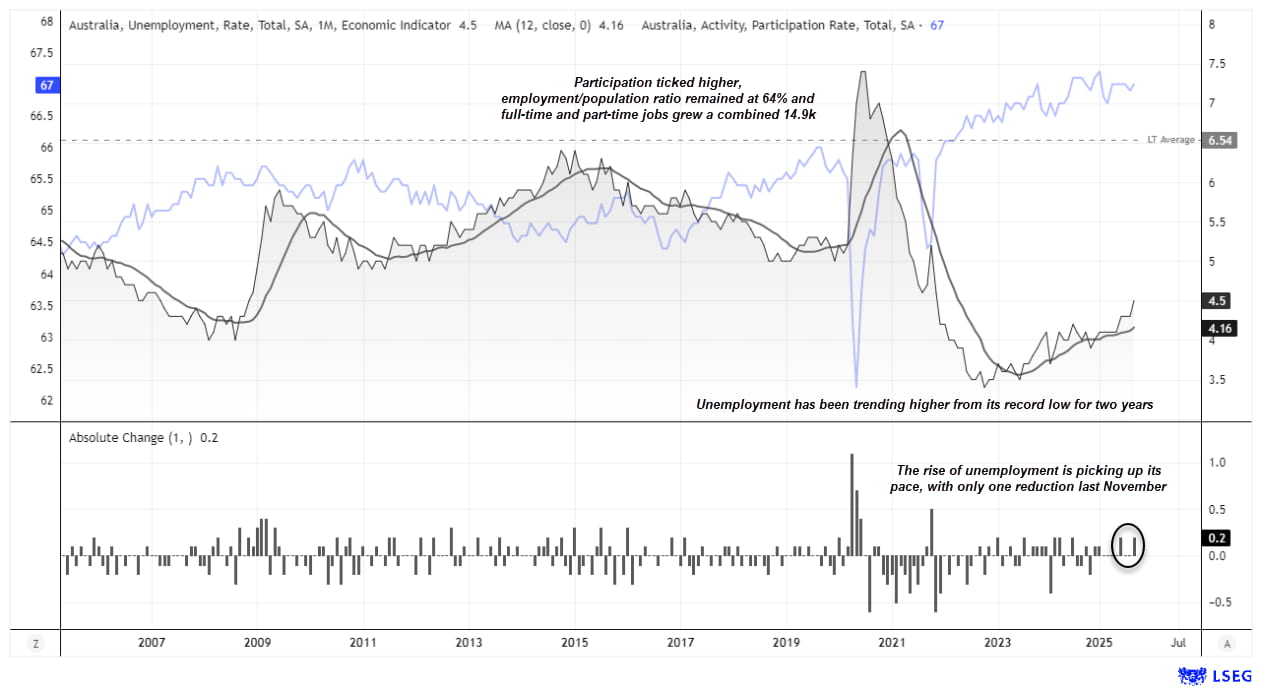
Chart analysis by Matt Simpson - data source: Australian Bureau of Statistic (ABS), LSEG
Employment Growth Remains Positive but Slows
Job growth was relatively weak at 14.9k, but still growing with 8.7k full-time jobs added to 6.2k part time. While August’s figures saw job growth revised lower to -11.k from -5.4k (and full-time to -48.k from -40.9k), this is backwards looking and not a huge increase from the original estimates.
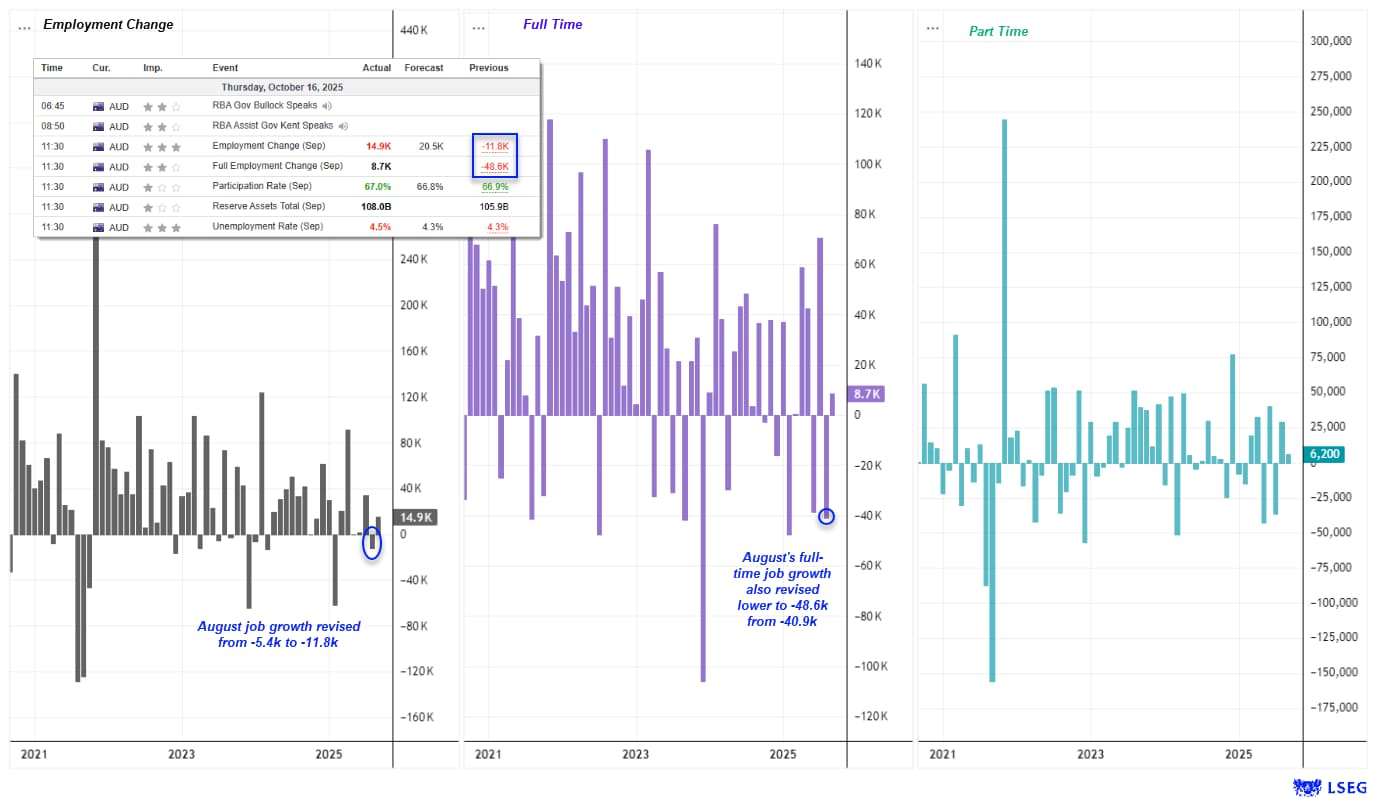
Chart analysis by Matt Simpson - data source: Australian Bureau of Statistic (ABS), LSEG
RBA Rate Cut Speculation Builds — But It’s Not a “Slam Dunk”
While this has renewed some market excitement about a potential RBA rate cut, I don’t think it makes it a slam dunk. The participation rate ticked up by 0.1 percentage point to 69%, not far from its record high. The employment-to-population ratio held steady at 64%, and 14.9k jobs were added overall — with full-time employment up 8.7k and part-time up 6.2k. These figures aren’t exactly screaming “recession,” even though unemployment is rising.
RBA Minutes Highlight Ongoing Inflation Risks
The RBA minutes were slightly more hawkish, noting that household consumption and growth have been stronger than expected. Policymakers described the labour market as still “tight.” Even if today’s data suggest it’s slightly less so, the employment sector has hardly collapsed. Perhaps more importantly, the minutes also stated that “recent data suggested that inflation in the September quarter may be higher than had been expected in the August Statement on Monetary Policy.”
RBA Likely to Wait for CPI Before Considering Rate Cuts
Ultimately, I do not see the RBA cutting rates without first seeing the next quarterly CPI figures — particularly while they remain on guard for higher-than-expected inflation, stronger growth, and resilient consumption, even as unemployment edges higher.

AUD/NZD Leads Losses as Australian Dollar Slumps
The Australian dollar is the weakest currency of the day, with bears toying with the idea of an RBA rate cut in December. AUD/USD is the weakest major pair, currently down 0.4%, while AUD/JPY fell as much as 0.8% before recovering some losses. AUD/NZD is the weakest Australian dollar cross, down 0.7% on the day, and has also been the most volatile — trading within a high-to-low range equal to 128% of its 10-day ATR.
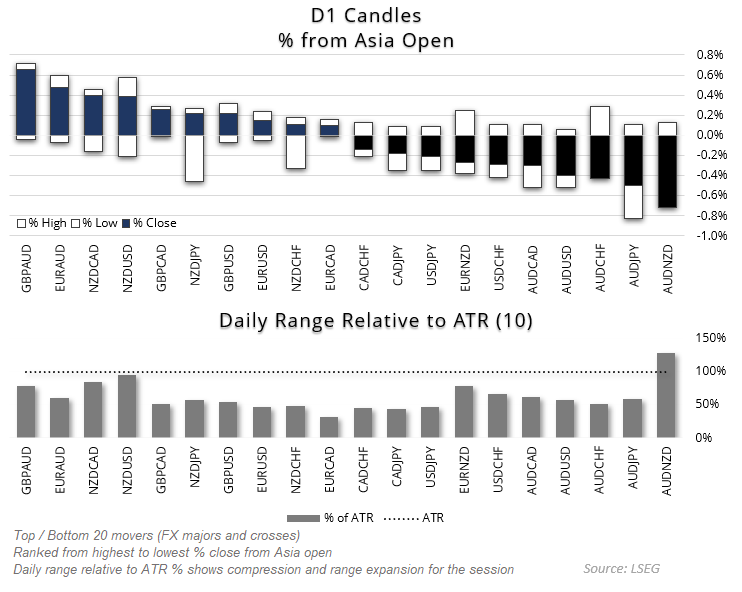
Chart analysis by Matt Simpson – data source: LSEG.
AUD/NZD Technical Analysis: Australian Dollar vs New Zealand Dollar
The weekly chart shows that the strong rally from the May low has come to a halt, with a shooting star and bearish pinbar hinting at a retracement. Today’s news flow has worked against the Australian dollar, sending AUD/NZD to a three-week low.
The daily chart suggests a head and shoulders top pattern has formed, projecting a downside target near the 38.2% Fibonacci retracement, around 1.1140. Unless a swift rebound occurs, AUD/NZD is on track for a bearish engulfing or outside day.
Bears may look to fade into rallies within today’s range and maintain a near-term bearish bias while prices remain beneath 1.14. Note that the 2024 high, monthly S1 pivot, and 50-day EMA converge around 1.1180, creating a potential support zone ahead of the H&S downside target.
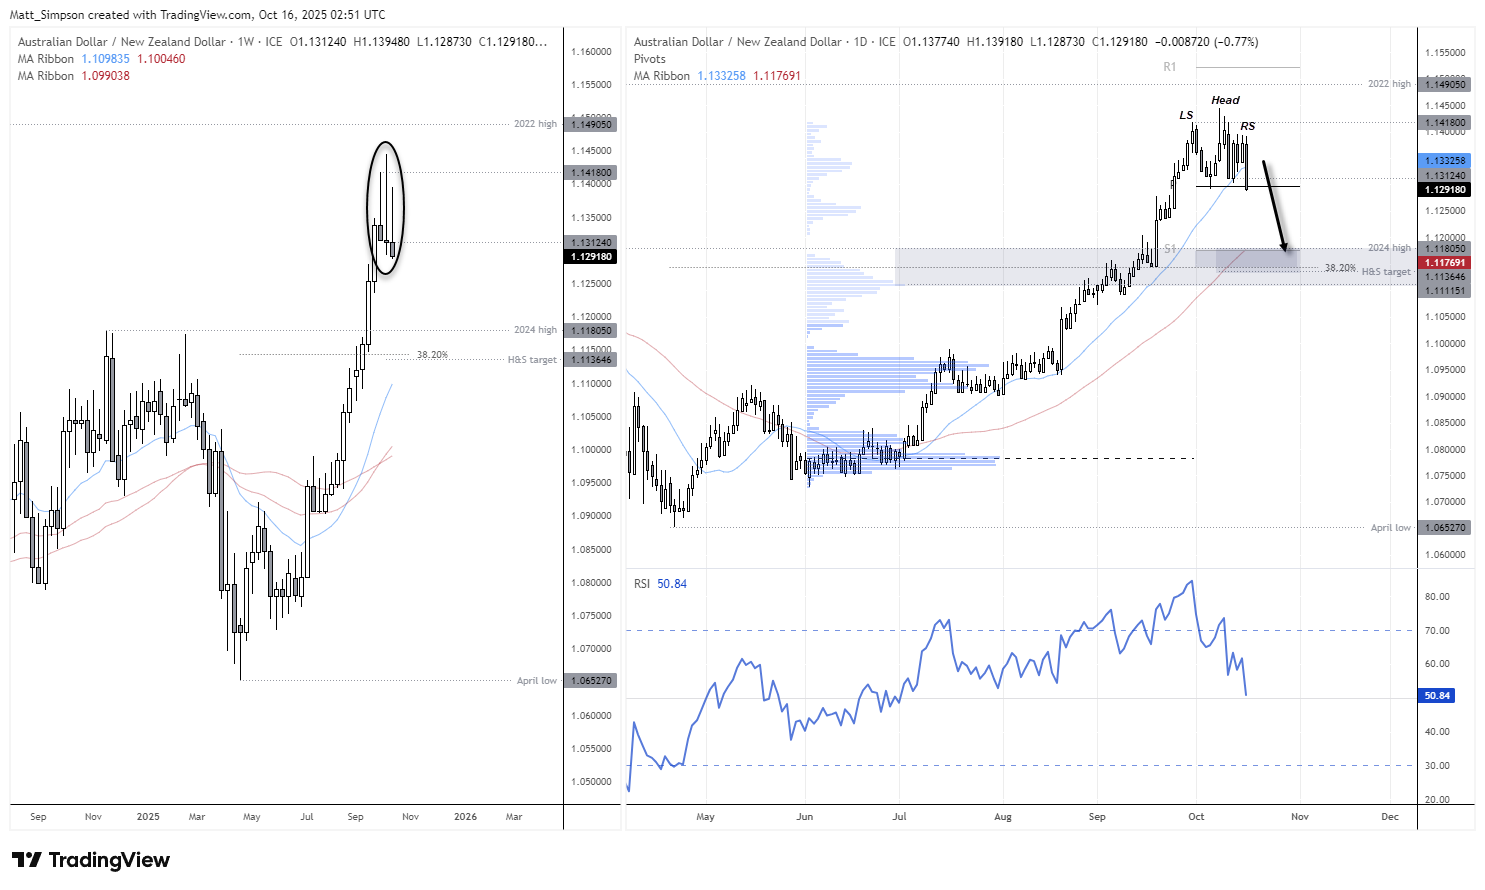
Chart analysis by Matt Simpson - Source: LSEG
View the full economic calendar
-- Written by Matt Simpson
Follow Matt on Twitter @cLeverEdge
How to trade with City Index
You can trade with City Index by following these four easy steps:
- Open an account, or log in if you’re already a customer
• Open an account in the UK
• Open an account in Australia
• Open an account in Singapore
- Search for the market you want to trade in our award-winning platform
- Choose your position and size, and your stop and limit levels
- Place the trade


