
The Australian dollar caught another bid after the latest CPI figures confirmed inflation remains elevated and broadly in line with expectations.
Headline CPI held at 3.8% y/y, while trimmed mean inflation – the RBA’s preferred gauge – remained at 3.4% y/y for a second consecutive month. That marks a fourth straight month above the upper end of the central bank’s 2–3% target band.
Although the monthly trimmed mean rose just 0.2% m/m versus 0.4% expected, the softer monthly print does little to alter the broader picture. Annual core inflation remains entrenched above target.
View related analysis:
- Australian Dollar Outlook: Bullish Momentum Builds Above 70c
- AUD/JPY Outlook: Reversal Clues Threaten the Mighty Aussie Yen Trend
- Australian Jobs Strong Enough to Keep RBA Alert, But Not Force Action
- Australian Dollar Outlook: AUD/USD Rally Vulnerable to Chop at the Top
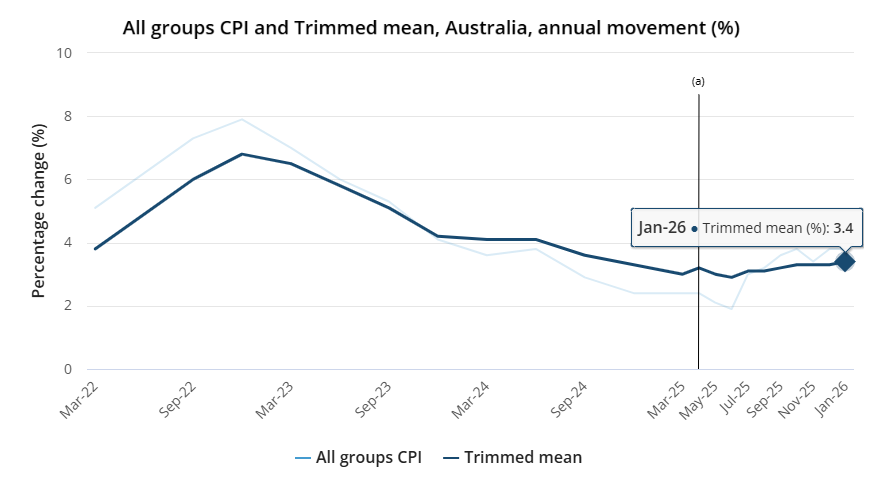
Source: ABS
Australian Inflation Pressures Remain Broad
Housing costs continue to run hot, services inflation remains sticky, and energy-related components are still filtering through the basket. This is not a narrow, one-off distortion. The persistence across key categories keeps underlying inflation elevated and complicates the policy outlook.
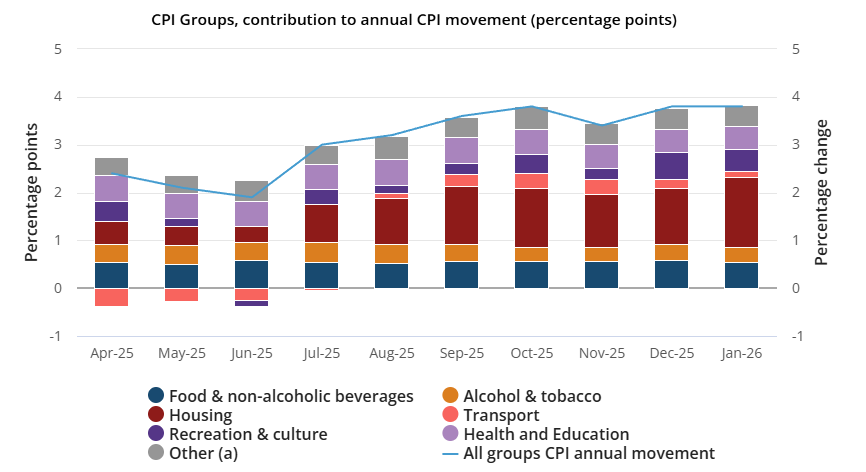
Source: ABS
RBA Tightening Path Strengthens as Inflation Holds Above Target
With Governor Michele Bullock stating that inflation above 3% is “unacceptable”, it is difficult to ignore a backdrop where headline CPI is running at 3.8% and core measures remain at 3.4%. Today’s figures simply reinforce the RBA’s tightening bias.
The Board has been clear that returning inflation sustainably to target is the priority. With core inflation steady above the band and price pressures proving sticky, policy is likely to remain restrictive. If upcoming data fails to show convincing moderation, the probability of further tightening later in the year remains live.
The RBA is now on a tightening path following its 25bp hike earlier this month. The question is when, not if. If inflation continues to heat up, the Bank may not wait for the quarterly figures in April, bringing March into play as a live meeting — particularly if employment data continues to show solid job growth and a lower unemployment rate.

Australian Dollar Firms as CPI Reinforces Tightening Outlook
The Australian dollar moved higher across the board following the CPI release. AUD/USD rose around 0.25% in the first hour, while the Aussie gained roughly 0.2% against the euro, Swiss franc, British pound and Canadian dollar.
The relatively modest reaction suggests the move confirmed existing expectations rather than delivering a genuine surprise. Markets appear to accept that further tightening is coming, with a portion of that outlook already priced in.
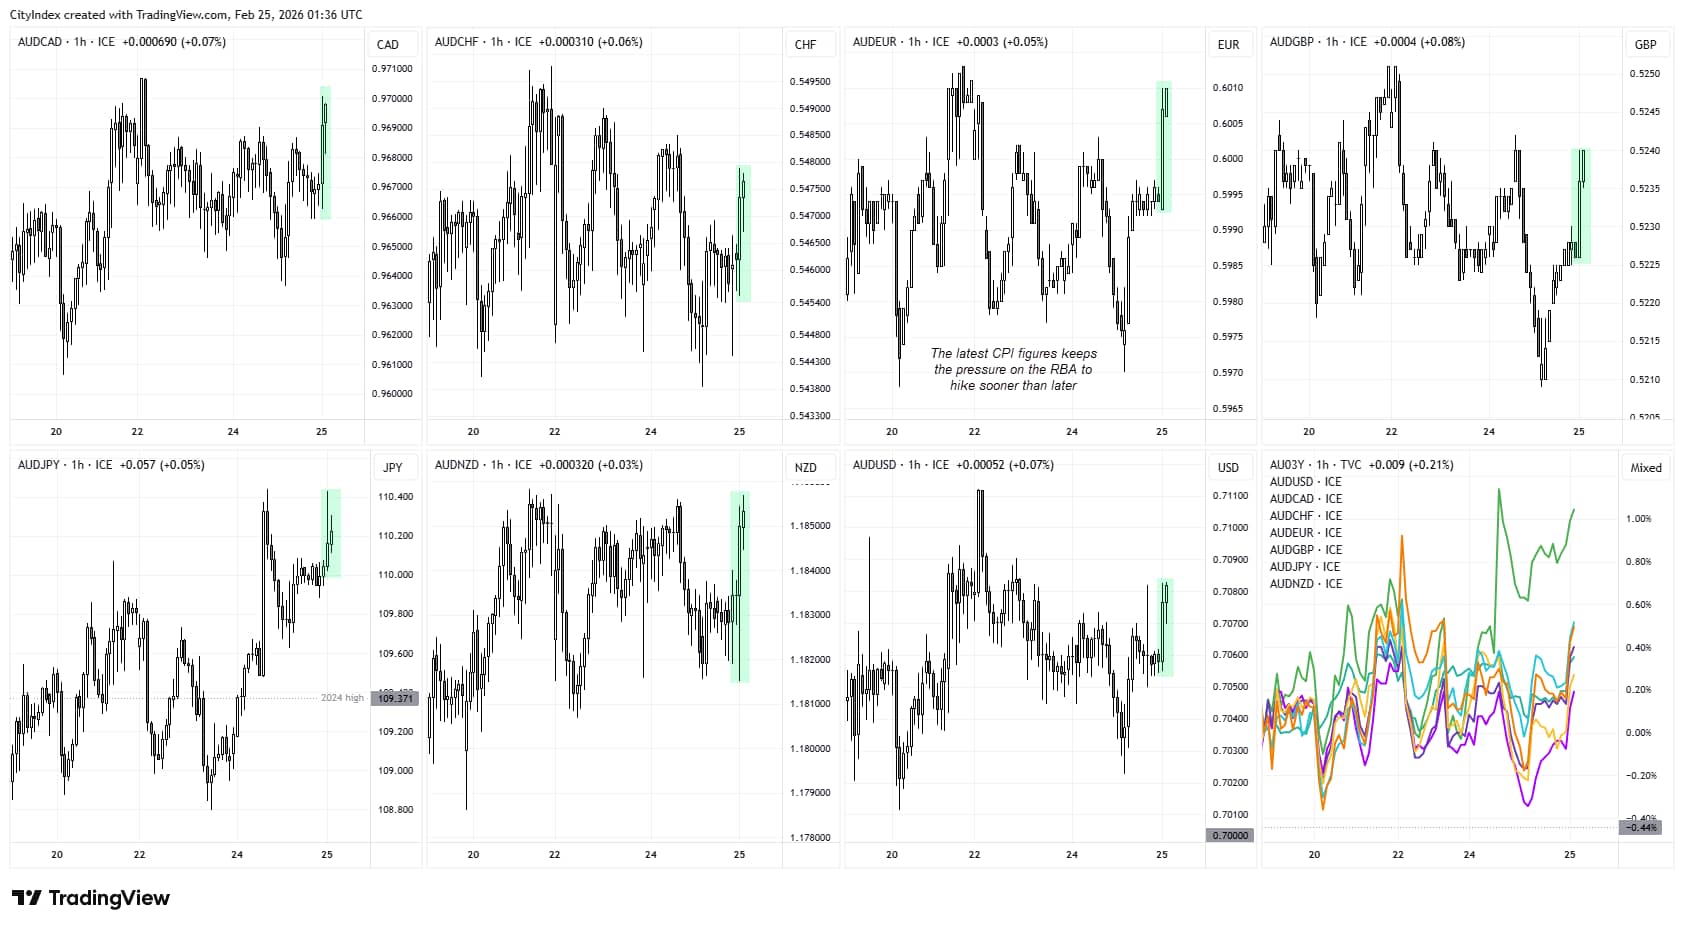
Source: ICE, TradingView
AUD/USD Technical Analysis: Australian Dollar vs US Dollar
The daily chart shows the Australian dollar remains in an apparent bullish consolidation pattern near its three-year highs. A bullish outside day on Friday respected the 20-day SMA and 70c handle as support, and momentum is trying to curl higher.
Were it not for geopolitical tensions surrounding Iran, AUD/USD would likely be well above 71c by now. Risk reversals show that options bets have been skewed towards downside protection, but with the 1-week 10-delta (red) and 25 delta (blue) curling higher this week, perhaps they’re coming around to the potential for a bullish breakout.
The bias remains for a move towards the 2023 high (0.7175) while AUD/USD holds above 70c, with a break above 0.72 bringing the June high into focus near the 0.73 handle. A break beneath 0.70 warns of a deeper pullback, though we’d need to see prices trade beneath the 0696 swing low before becoming more concerned over a trend reversal.
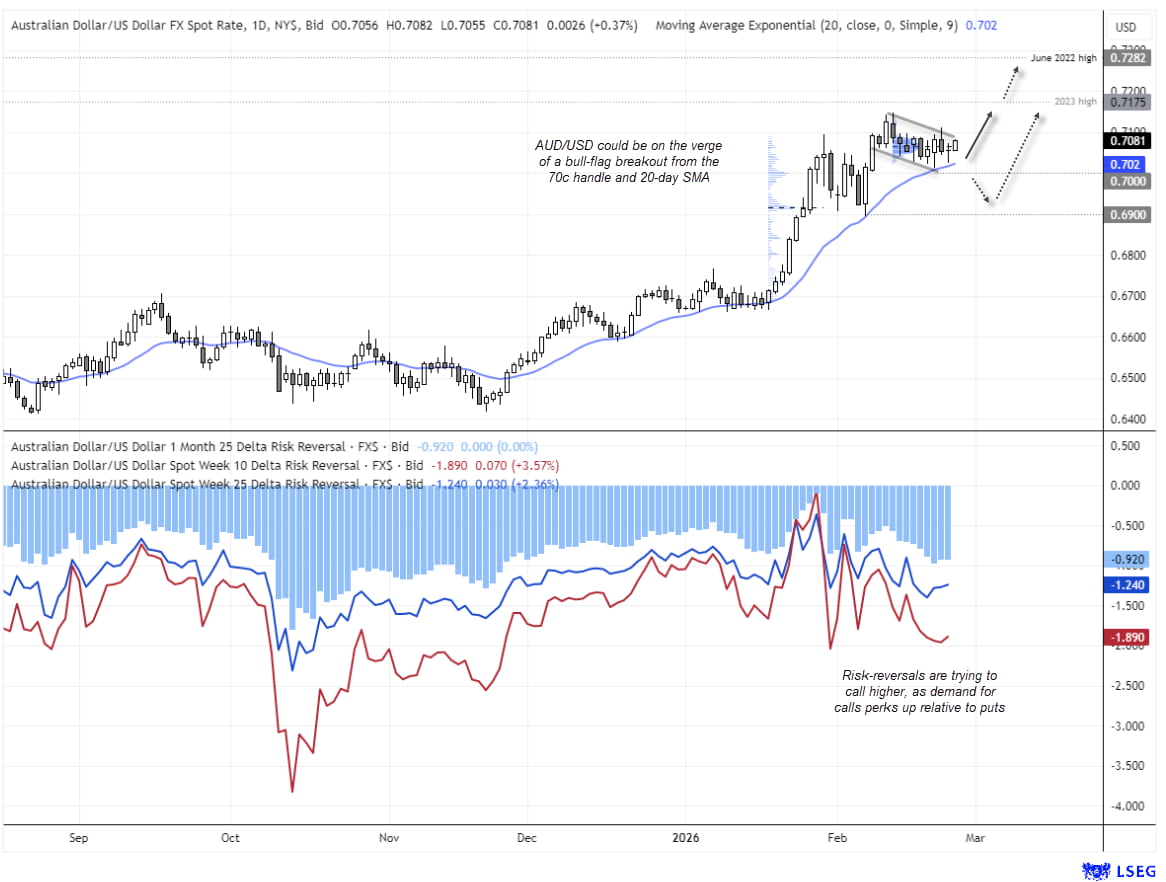
Source: ICE, TradingView
-- Written by Matt Simpson
Follow Matt on Twitter @cLeverEdge
How to trade with City Index
You can trade with City Index by following these four easy steps:
- Open an account, or log in if you’re already a customer
• Open an account in the UK
• Open an account in Australia
• Open an account in Singapore
- Search for the market you want to trade in our award-winning platform
- Choose your position and size, and your stop and limit levels
- Place the trade