
AUD/USD 6-Day Rally Into GDP and US Data Deluge
AUD/USD enters the week on a six-day winning streak — its strongest run since April — driven by broad US dollar weakness, firm Australian data and solid risk appetite. With Q3 GDP due and a dense US data calendar dominated by PMIs, PCE and labour metrics, traders should expect volatility to remain elevated.
View related analysis:
- ASX 200 Market Outlook: NAB Teases Bears as Financials Form a Bear Flag
- USD/JPY, Nikkei Outlook: Japanese Yen Weakens amid Risk-On Tone
- Nasdaq 100 Leads Wall Street, Meta Bounce Gains Traction
- Australian Dollar Outlook: AUD/USD Faces CPI Test as USD Strength Persists
Australian Dollar Performance
- AUD/USD was the second-strongest FX major last week as broad US dollar weakness revived expectations of a December Fed cut.
- The Aussie rose against the USD for a sixth straight day on Friday, marking its best bullish run since April.
- A risk-on tone across global markets helped the Australian dollar strengthen against safe-havens, with AUD/JPY closing at a 16-month high and AUD/CHF hitting a two-week high.
- AUD/NZD was the outlier, with the pair falling for a third straight week.
- NZD/USD outperformed after the RBNZ signalled it has likely reached the end of its easing cycle when it cut rates by 25bp as expected.
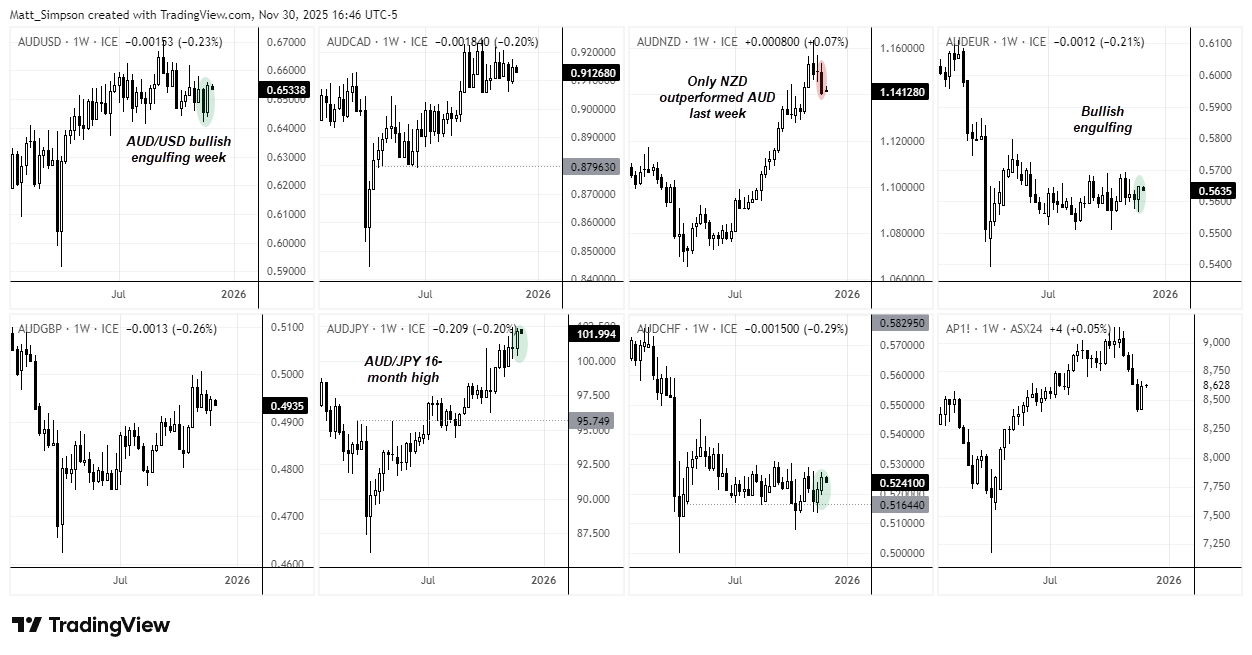
Chart prepared by Matt Simpson - Source: Tradingview
This image will only appear on cityindex websites!

Australia This Week: Economic Data and Events for AUD/USD Traders
|
Date |
AEDT (GMT +11) |
Event |
|
Mon |
09:00 |
AU Judo Bank Manufacturing PMI (Nov) |
|
|
11:30 |
AU ANZ Job Advertisements (Nov), Company Gross Operating Profits, Business inventories (Q3) |
|
|
12:45 |
CN Caixin Manufacturing PMI (MoM) (Nov) |
|
Tue |
01:45 |
US S&P Global Manufacturing PMI (Nov), ISM Manufacturing (Nov) |
|
|
08:45 |
NZ Terms of Trade Index (Q3) |
|
|
11:30 |
AU Building Approvals (Oct), Current Account (Q3) |
|
Wed |
02:00 |
US FOMC Member Bowman Speaks, JOLTS Job Openings (Sep) |
|
|
02:10 |
US IBD/TIPP Economic Optimism |
|
|
09:00 |
AU AIG Construction, Manufacturing (Nov) |
|
|
11:30 |
AU GDP (Q3) |
|
Thu |
00:15 |
US ADP Nonfarm Employment Change (Nov) |
|
|
01:15 |
US Industrial, Manufacturing Production (Sep) |
|
|
01:45 |
US S&P Global Composite PMI (Nov) |
|
|
02:00 |
US ISM Non-Manufacturing PMI (Nov) |
|
|
11:30 |
AU Trade Balance (Oct) |
|
|
23:30 |
US Challenger Job Cuts |
|
Fri |
00:30 |
US Jobless Claims |
|
|
04:00 |
US FOMC Member Bowman Speaks |
|
Sat |
00:00 |
US Core PCE Price Index (Sep) |
Traders are finally seeing the backlog of US economic data cleared, which makes this week’s calendar feel particularly heavy.
Australian Q3 GDP in Focus as Risks Tilt to the Upside
On the Australian side, Q3 GDP on Wednesday is the main event. The current account release includes net export contribution to GDP, and any surprises there can prompt the big four banks to update their GDP calls a day early — occasionally creating the larger market move.
Annual GDP growth rose to a seven-quarter high of 1.8% in Q2, and the quarterly rate is expected to lift to 0.7% in Q3, the strongest since Q4 2022. Given the hot inflation print, firm labour data and resilient household spending, the risk leans towards an upside surprise rather than a miss. That would likely nudge H2 2026 rate-hike expectations higher and support the Australian dollar into a month that typically delivers seasonally bullish returns.
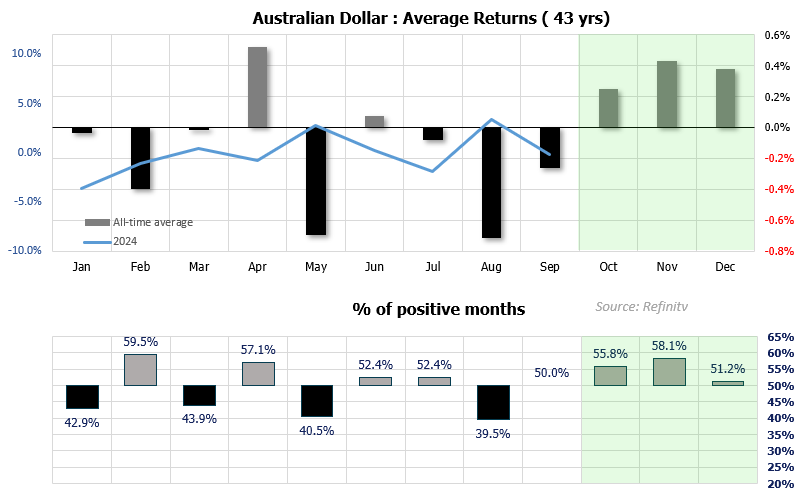
Chart prepared by Matt Simpson - Source: LSEG
US Data Deluge and Dovish Fed Rhetoric Keep AUD/USD Supported
The US has no shortage of data this week, with ISM PMIs, S&P Global PMIs, PCE inflation and employment figures via ADP and JOLTS all on deck. Traders remain highly sensitive to softer US releases to justify cuts. And with President Trump turning his ire back toward Jerome Powell, it’s no surprise several FOMC members are suddenly leaning dovish ahead of the blackout period — almost as if they’re vying to be the one chosen to replace their boss next year.
With Australian data still firm and USD bears likely to favour bad news over good amid the dovish Fed chatter, AUD/USD has room to extend higher into this week.

AUD/USD Technical Analysis: Australian Dollar vs US Dollar
The 10-day correlations show that the Australian dollar’s direction remains firmly tied to Fed expectations (via the US dollar) and risk sentiment on Wall Street. The 10-day correlation between AUD/USD and the Nasdaq 100 is strong at 0.83, while the inverse relationship with the DXY is even stronger at -0.85. These correlations were weak only a couple of weeks ago, so their resurgence is noteworthy heading into a US-heavy data week.
The positive correlation between the Chinese yuan (CNH/USD) and AUD/USD has also returned, although this likely reflects broader USD dynamics rather than independent CNH strength.
The weekly chart shows a bullish engulfing candle above the August low. Dips toward 0.6500 may attract buyers, given the proximity of the 200-day EMA (0.6496). Also note the 50-day EMA (0.6520), monthly pivot (0.6516) and VPOCs near 0.6527, which could help limit retracements and keep pullbacks shallow.
A move toward the October high — and a possible break above it — remains in play, although the November high at 0.6580 may provide resistance along the way.
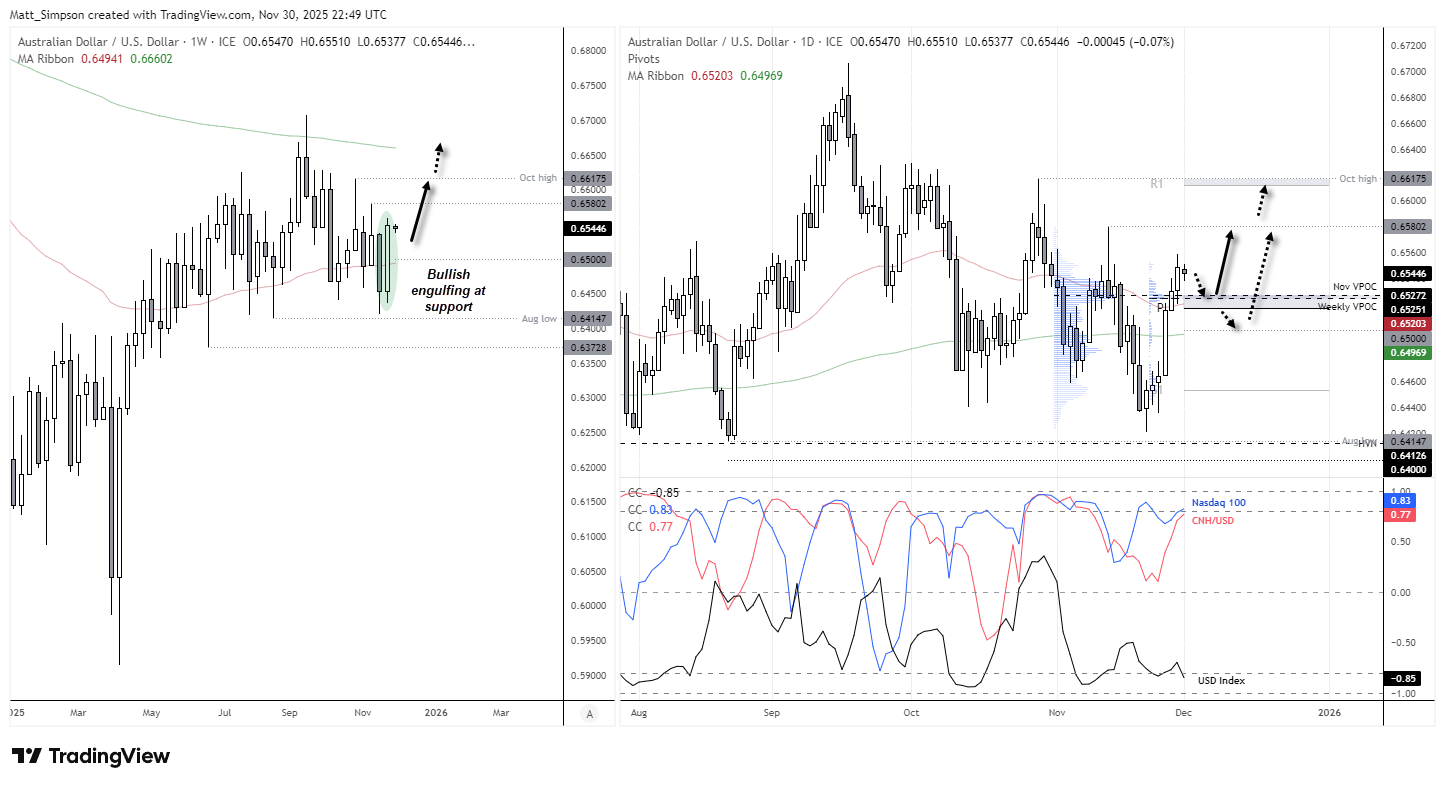
Chart analysis by Matt Simpson - data source: TradingView AUD/USD
View the full economic calendar
-- Written by Matt Simpson
Follow Matt on Twitter @cLeverEdge
How to trade with City Index
You can trade with City Index by following these four easy steps:
- Open an account, or log in if you’re already a customer
• Open an account in the UK
• Open an account in Australia
• Open an account in Singapore
- Search for the market you want to trade in our award-winning platform
- Choose your position and size, and your stop and limit levels
- Place the trade