


The Australian dollar stabilised last week after heightened volatility, finding support near the 0.6450 level as AUD/USD reclaimed its 200-day EMA. Traders now look to the RBA’s tone, Governor Bullock’s speech, and fresh US data for direction, with sentiment and technical levels hinting at potential upside momentum in the near term.
View related analysis:
- Australian Dollar Falls as Unemployment Hits 4-Year High
- ASX 200 Outlook: RBA to Stay Cautious After Softer Employment Report
- ASX 200 Morning Market Outlook: Bad News Is Good News for ASX
- Nasdaq 100, S&P 500, Dow Jones Outlook: Has The Dead Cat Bounced?
AUD/USD Outlook: RBA and US Data to Drive Next Move for the Australian Dollar
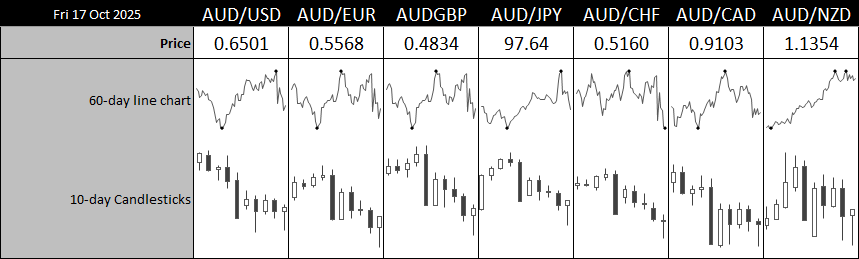
Chart prepared by Matt Simpson - Source:LSEG
Volatility Eases but AUD/CHF and AUD/JPY Stay Active
Volatility was slightly lower for the Australian dollar overall last week, though it remained elevated against the Japanese yen and Swiss franc. AUD/CHF fell to its lowest level amid its most volatile week in six months, though it managed to pare losses on Friday to close down just 0.4%. While AUD/JPY endured its second most volatile week in six months, it effectively closed flat for a second consecutive week. Still, I had warned that the Japanese yen sell-off appeared stretched, and we’ve now seen an impressive pullback over the past two weeks.
Looking across Aussie dollar pairs overall, my hunch is that we’ll see it retrace higher again this week. AUD/USD is back above the 200-day EMA, and last week’s price action suggests demand resides around 0.6450.

RBA and Australian Data in Focus
Last week’s softer employment report reignited hopes of a November RBA cut, though the central bank will almost certainly want to see the quarterly CPI figures on October 30 before committing to further easing. While Governor Bullock is set to speak at the Bradfield Oration on Thursday, the event has historically been used to focus on long-term economic themes – such as productivity, housing supply, or structural challenges – rather than to set near-term policy signals. Still, should she acknowledge two consecutively weaker employment reports, the Australian dollar could come under pressure.

Chart prepared by Matt Simpson, data source: LSEG Investing.com.
US Data Could Sway Risk Appetite
US data is beginning to trickle in following the backlog caused by the recent government shutdown, with September’s inflation figures pencilled in for release on Friday. However, the data may carry a higher degree of uncertainty or revision risk due to the disruption.
S&P Global’s flash PMI and the University of Michigan’s consumer sentiment survey are also on the calendar and could attract greater attention given the general data vacuum. With the Fed now placing more weight on employment data than inflation, particular focus will fall on the PMI’s employment sub-index, as any signs of weakness could raise expectations of a more dovish stance from the Fed.
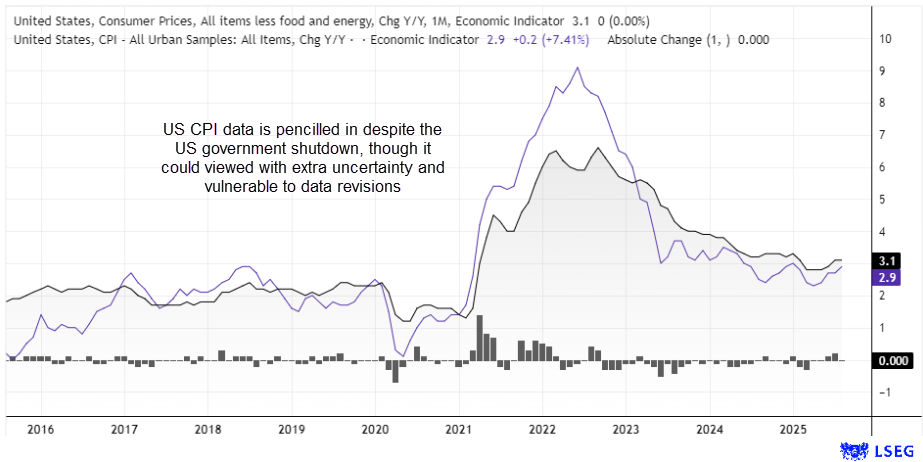
Chart prepared by Matt Simpson - Source: US Bureau of Labour Statistics (BLS)

AUD/USD Correlations
The Australian dollar appears to be taking its directional cue from Wall Street sentiment, with the 10-day correlation between AUD/USD and the S&P 500 sitting around 0.85. This has seen the usually tight relationship with the US dollar become non-existent over the past 10 days, with an effective correlation of zero. Also note the weak relationships with two-year yields, the Chinese yuan and copper over the past couple of weeks.
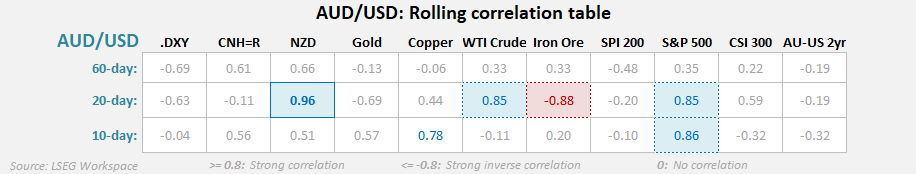
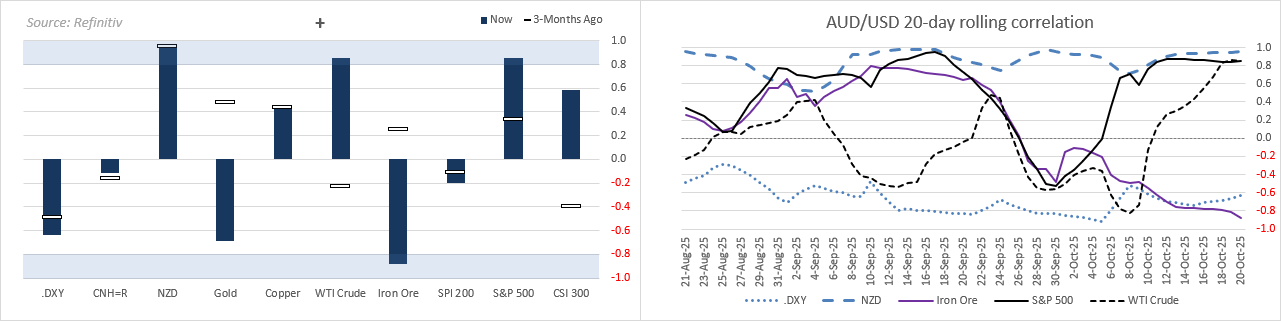
Chart analysis by Matt Simpson - Source: LSEG
AUD/USD Technical Analysis
The daily chart shows two lower spikes from last week, suggesting demand around the 0.6440 area. With prices now back above the 200-day EMA and the monthly S1 pivot point, dips within last week’s range may attract buyers looking for a short-term mean reversion higher.
With trend resistance nearby, I’m not expecting a strong upside move at this stage. I remain open to the potential for a lower high to form around resistance, or for a break above it if momentum builds. Ultimately, a fresh catalyst — likely from upcoming US data — is needed before larger directional moves can develop. Until then, a gradual mean-reversion bias to the upside appears the more probable scenario based on last week’s price action.
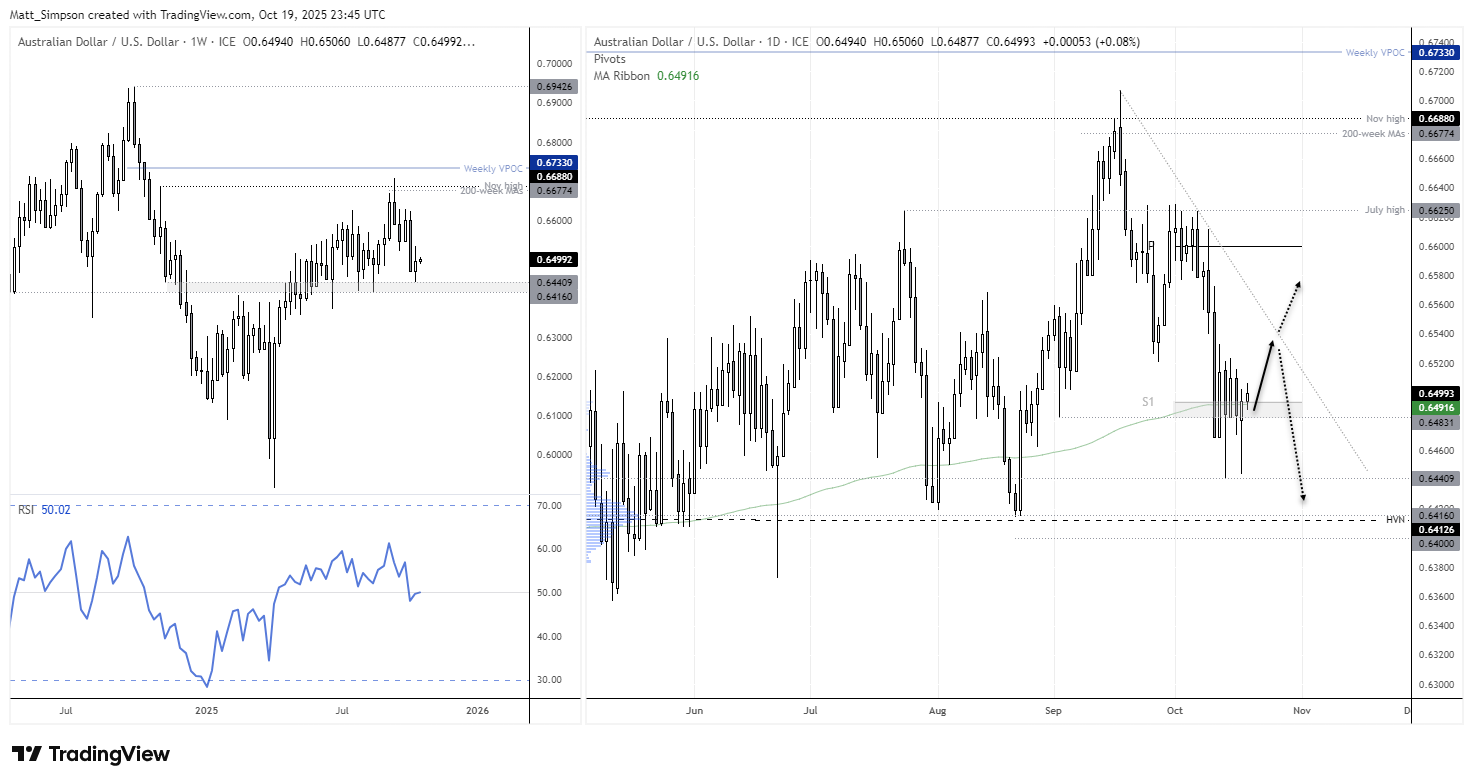
Chart analysis by Matt Simpson - Source: TradingView
View the full economic calendar
-- Written by Matt Simpson
Follow Matt on Twitter @cLeverEdge
How to trade with City Index
You can trade with City Index by following these four easy steps:
- Open an account, or log in if you’re already a customer
• Open an account in the UK
• Open an account in Australia
• Open an account in Singapore
- Search for the market you want to trade in our award-winning platform
- Choose your position and size, and your stop and limit levels
- Place the trade


