


The Australian dollar enters a critical week with the RBA decision on Tuesday, employment data on Thursday and a pivotal FOMC meeting in between. AUD/USD has already posted its best two-week rally since April, supported by rising yields, stronger risk sentiment and a softer US dollar. Whether that momentum extends or stalls now rests largely on the Fed’s updated rate projections.
View related analysis:
- US Dollar Seasonality in December: USD/JPY, USD/CHF, EUR/USD, AUD/USD
- US Dollar Shows Signs of Stability Into PCE Inflation: USD/JPY, USD/CHF
- ASX 200 Market Outlook: Can Santa’s Rally Help the ASX This December?
- Australian Dollar Outlook: AUD/USD 6-Day Rally Into AU GDP, US Data Deluge
Australian Dollar Outlook
Australian Dollar Performance
- AUD/USD was the strongest FX major last week, to mark its best 2-week run since the April low at 2.8%
- AUD/JPY rose to a 71-week high thanks to a risk-on tone amid a weak Japanese yen environment
- AUD/CHF reached a 25-week high as safe-haven currencies moved lower in tandem
- EUR/AUD also fell to a 25-week low to suggest a larger move lower is now underway, following its inability to break above 1.8 in recent months
- GBP/AUD looks set to be headed to 2.0 and potentially lower after momentum has realigned with its dominant bearish trend

Chart prepared by Matt Simpson - Source: LSEG
Australia This Week: Economic Data and Events for AUD/USD Traders
|
Date |
AEDT (GMT +11) |
Event |
|
Tue 9 Dec |
02:00 |
US Dallas Fed PCE (Sep) |
|
|
03:00 |
US 1-Year Consumer Inflation Expectations (Nov) |
|
|
11:30 |
AU Building Approvals (Oct), NAB Business Confidence (Nov) |
|
|
13:00 |
CN Trade Balance (Nov) |
|
|
14:30 |
AU RBA Interest Rate Decision (Dec) (Hold Expected)) |
|
|
15:30 |
AU RBA Rate Press Conference |
|
Wed 10 Dec |
00:15 |
US ADP Employment Change Weekly |
|
|
11:30 |
AU RBA Chart Pack Release |
|
Thu 11 Dec |
06:00 |
US Fed Interest Rate Decision, Statement, Economic Projections |
|
|
06:30 |
US FOMC Press Conference |
|
|
08:45 |
NZ Electronic Card Retail Sales (Nov) |
|
|
11:30 |
AU Employment Change (Nov) |
|
Fri 12 Dec |
00:30 |
US Jobless Claims |
Rates on Hold but Risks Still Tilt Hawkish
We’ve got an RBA meeting on Tuesday and employment data on Thursday. I should be more excited, but there’s little new to add: the RBA is almost certain to hold, cuts are firmly off the table, and another solid jobs report looks likely. Governor Bullock signalled last week that a hike is possible if inflation stays sticky — which effectively rules out any move this week given quarterly CPI isn’t released until late January. Ultimately, the Fed meeting remains the bigger driver for the Aussie via the US dollar.

Fed Meeting Remains the Dominant AUD/USD Catalyst
While the soft ADP print revived hopes for more Fed cuts next year, last week’s broader US data doesn’t justify a materially dovish stance. A 25bp cut is expected and likely, but ISM services remains in expansion, consumer sentiment is rising, layoffs are falling and jobless claims beat expectations. That’s not the backdrop for a noticeably dovish dot plot.
This is the final FOMC meeting of the year with updated staff projections, and traders will be focused on the 2025 rate path. Fed funds futures price an 86.2% chance of a 25bp cut this week, but only a 40.3% chance of another in April and 32.1% in September. The US dollar will take its lead from the median rate outlook. Three implied cuts would meaningfully pressure the dollar; two still allow December’s usual bearish USD seasonality to play out, while a third would amplify the move.
AUD/USD Correlations
Copper continues to show the strongest positive relationship with AUD/USD across the 10-, 20- and 60-day windows. That stands out given the sharp drop in the Aussie–yuan 10-day correlation to 0.37 over the past fortnight. The move is largely explained by the deeply inverted relationship between the US dollar and AUD/USD, sitting at -0.90 on the 10-day and -0.95 on the 20-day lookback.
Risk appetite remains supportive for the Aussie, with correlations to the S&P 500 and Dow Jones holding near 0.8 on the 10-day window and at least 0.85 on the 20-day. The 60-day correlations also sit just below 0.8.
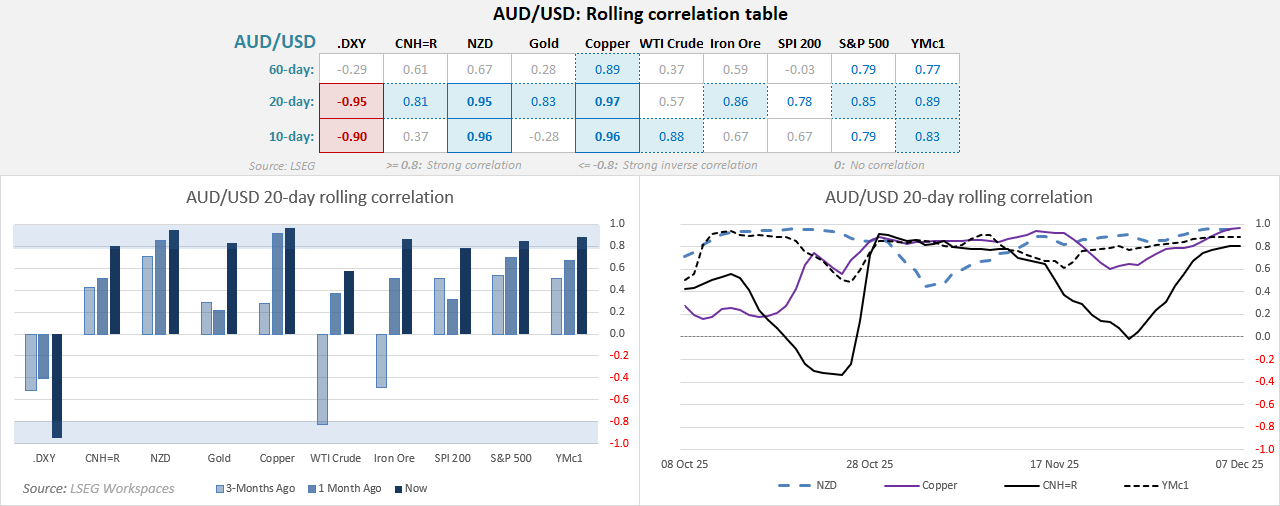
Chart prepared by Matt Simpson - Source: LSEG
AUD/USD Technical Analysis: Australian Dollar vs US Dollar
Bond Yields and Options Flows Continue to Underscore AUD/USD Upside Bias
- The top panel shows Australian 2-year yields trending higher since July, alongside a widening AU–US 2-year yield spread. Bond markets have been signalling this AUD/USD strength well in advance.
- The lower-left panel shows 1-week implied volatility surging ahead of this week’s RBA and FOMC meetings, while 1-month volatility remains comparatively subdued and below the 1-week level.
- Options flow continues to favour buying dips in AUD/USD, with both the 1-week and 1-month risk reversals rising — indicating call (bullish) demand outpacing put (bearish) demand.
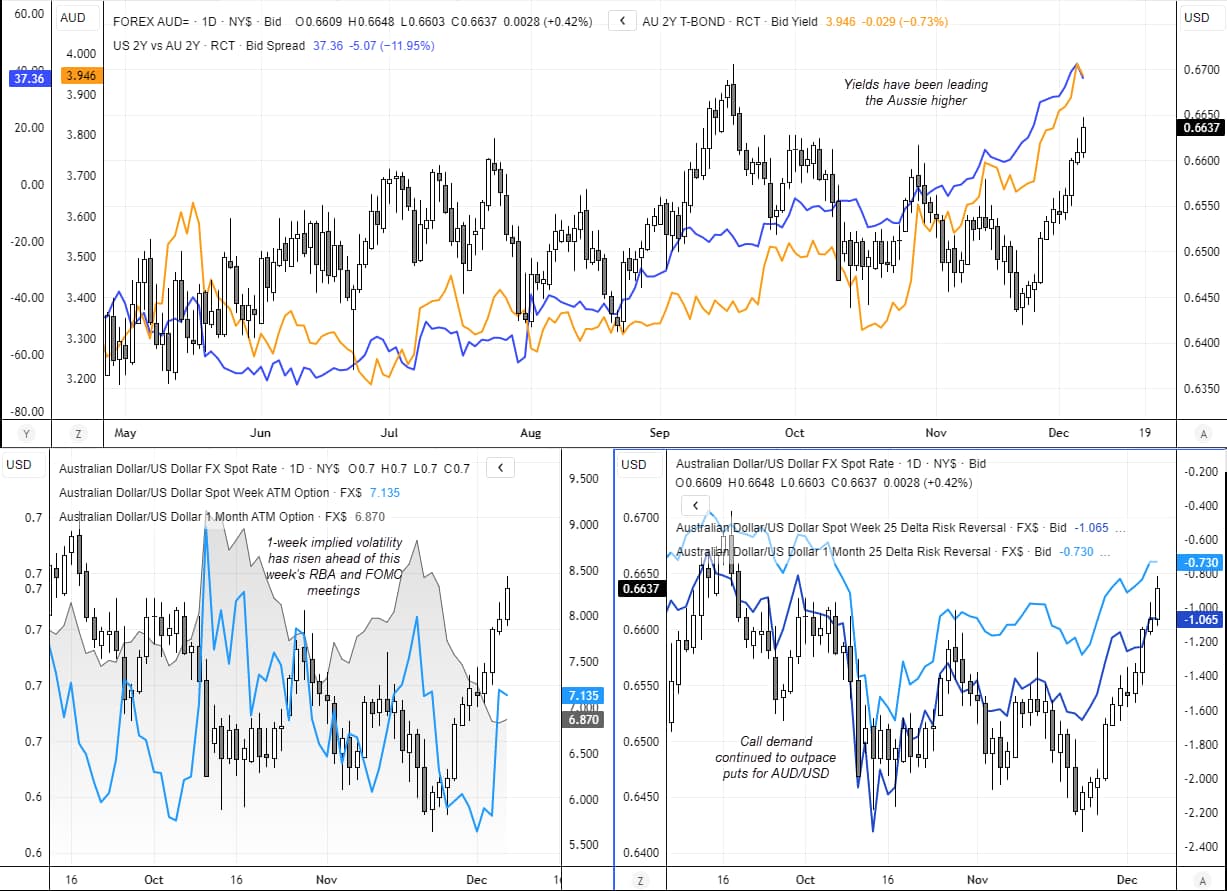
Chart prepared by Matt Simpson - Source: LSEG

Rate-of-Change Study Hints at Slower Aussie Gains
The weekly chart includes a two-week percentage rate-of-change series with a 2% threshold. Recent history shows the Aussie rarely exceeds this threshold for three straight weeks — and most surges fade after a single break. With AUD/USD already delivering two strong weekly gains and the September high sitting just over 1% away, bullish momentum may ease this week, particularly if the Fed is not as dovish as markets hope.
Even so, a break above the September high later in the month remains a realistic scenario, given the US dollar’s tendency to underperform in the second half of December.
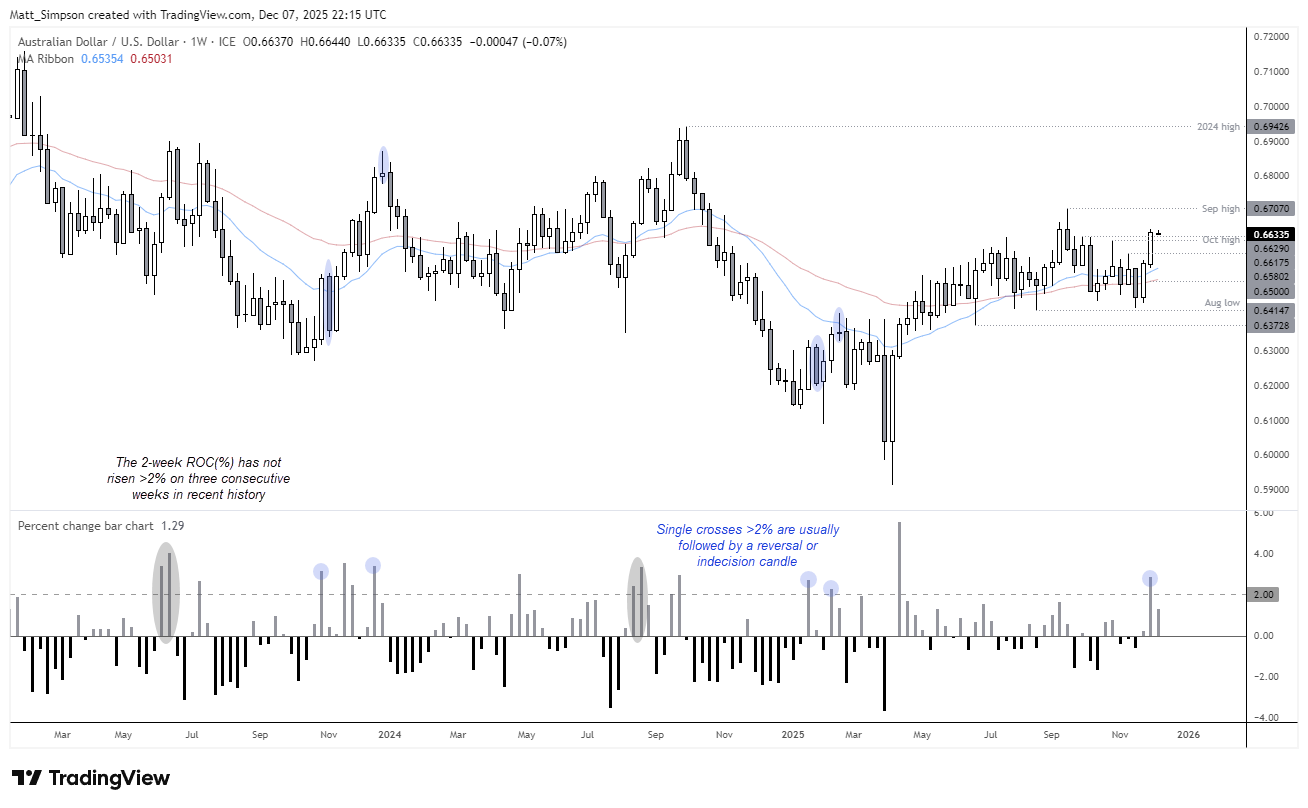
Chart analysis by Matt Simpson - data source: TradingView AUD/USD
Upside Targets Cluster Near 0.6700 and the September High
AUD/USD has rallied sharply from the 0.6420 low, with price moving almost vertically on the daily chart. The RSI(2) has pushed into overbought territory, yet no bearish divergence has formed, and the RSI(14) continues to confirm the broader uptrend without reaching overbought — a constructive signal for Australian dollar bulls.
A period of consolidation early in the week looks likely, with a potential retest of the October high at 0.6629. Even if momentum cools, a break below 0.6580 appears unlikely; that level aligns with a prior swing high and the 10-day EMA. Any dip into that zone is likely to attract buyers targeting a move toward the September high. The +1-week implied volatility band also sits just beneath 0.6700, adding further significance to that resistance area.
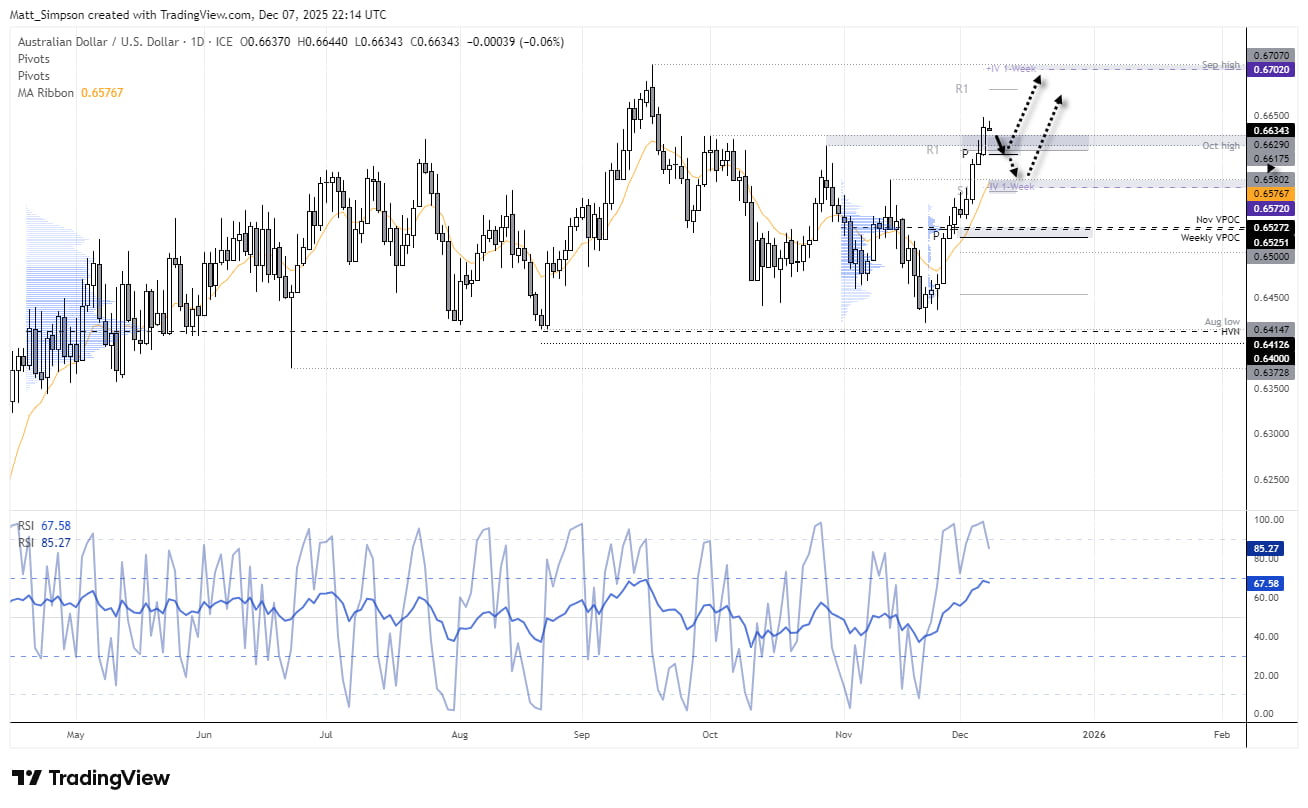
Chart analysis by Matt Simpson - data source: TradingView AUD/USD
View the full economic calendar
-- Written by Matt Simpson
Follow Matt on Twitter @cLeverEdge
How to trade with City Index
You can trade with City Index by following these four easy steps:
- Open an account, or log in if you’re already a customer
• Open an account in the UK
• Open an account in Australia
• Open an account in Singapore
- Search for the market you want to trade in our award-winning platform
- Choose your position and size, and your stop and limit levels
- Place the trade


