


The Australian dollar faces a potentially volatile week, with traders preparing for major catalysts including the Federal Reserve’s policy decision, Australia’s quarterly inflation report, and renewed US–China trade discussions. With RBA rate-cut expectations building and global sentiment uncertain, AUD/USD could see sharp moves in both directions.
View related analysis:
- Australian Dollar Outlook: AUD/USD Bulls Reclaim 200-Day, US CPI Looms
- Australian Dollar Consolidates: AUD/USD, EUR/AUD Near Pivotal Levels
- With US Dollar ‘Rebound’ Waning, EUR/USD and GBP/USD Could Bounce
- ASX 200 Morning Market Outlook: Woolworths (WOW) Set To Bounce?
AUD/USD Set for Volatile Week Ahead of Fed Decision and Australian CPI
US inflation data on Friday came in slightly softer than expected across the board, paving the way for the Fed to continue cutting rates. Fed funds futures implied a 98.3% chance of a 25bp cut next week and a 91.1% probability of another in December. A third successive cut is currently priced at around 50% for either the January, March, or April meetings.
The US dollar index initially dropped around 1% after the data release but regained ground by the close, ahead of US–China trade talks over the weekend in Kuala Lumpur, Malaysia. How those talks unfold could very much set the tone for the Trump–Xi summit, currently scheduled for 30 October in South Korea. Unless the negotiating wheels fall off and talks get cancelled. Either way, traders will need to factor in headline risks for the US dollar surrounding both the trade talks and the upcoming summit.

Australian Dollar Performance
- The Australian dollar was modestly higher against the Swiss franc, Japanese yen and New Zealand dollar, and marginally higher (but effectively flat) against the US dollar, Canadian dollar and British pound
- AUD/JPY rose for a sixth consecutive day – its best such run in nearly two months – and now sits at a 2-week high with 100 in its sights
- How it trades this week and which way it gaps at the open is likely down to headlines from US-China trade talks, though the Fed meeting and quarterly CPI figures for Australia are the key economic events
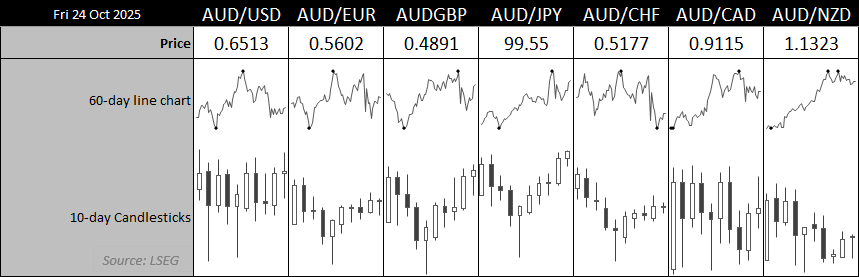
Chart prepared by Matt Simpson - Source: LSEG
Money Markets Favour RBA Cut Next Week
Money markets and economists are increasingly backing a 25bp rate cut by the RBA in November following the latest labour force data. Unemployment rose to a four-year high of 4.5%, while August’s figures for headline and full-time employment were revised further into negative territory. Although participation and employment-to-population rates remain historically high, RBA cash rate futures now imply a 75–80% probability of a cut at the next meeting
Given the hawkish tone of the latest minutes, I place the odds of a cut closer to 60% than 80%. However, the deciding factor will be this week’s quarterly inflation figures.

Chart prepared by Matt Simpson - Source: ABS, LSEG
Australian Quarterly Inflation Report in Focus
As things stand, unemployment has already exceeded the RBA’s end-of-year forecast of 4.3%, with the rate reaching 4.5% by September. The RBA’s Q3 estimates place headline CPI at 2.1% and the trimmed mean at 2.7%. However, monthly gauges of annualised inflation show headline CPI rising to 3.0% and the trimmed mean at 2.6%. It is therefore crucial that the quarterly trimmed mean does not move above 2.7% this week — a print of 2.6% or lower would likely confirm the November rate cut that many already anticipate.
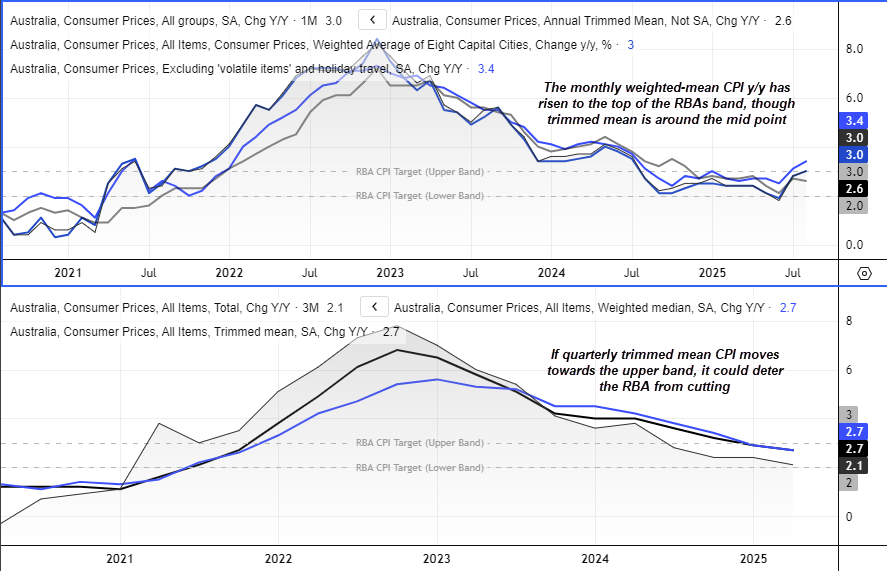
Chart prepared by Matt Simpson - Source: ABS, LSEG
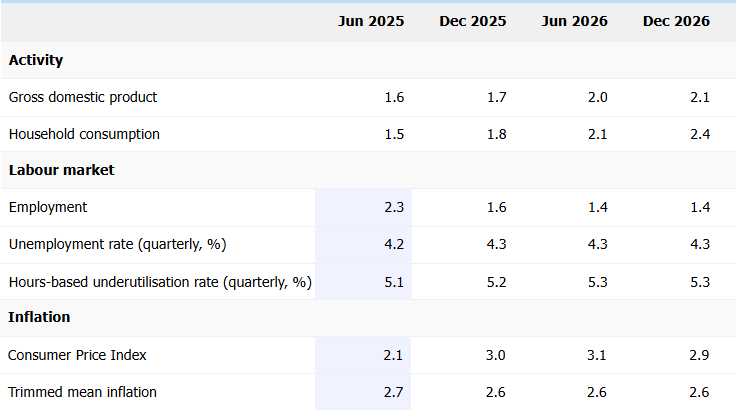
Chart prepared by Matt Simpson - Source: RBA, Statement of Monetary Policy (SOMP)
AUD/USD Correlations
- The usual correlations with the Australian dollar have largely broken down over the 20-day lookback, though the link between AUD/USD and NZD/USD remains strong.
- Even the relationship between the US dollar index and the Australian dollar has weakened to just 0.15 — effectively showing no correlation.
- However, with the 10-day correlation between AUD/USD and copper rising to 0.89 (and the 20-day at 0.68), it suggests the Aussie’s direction could become increasingly influenced by China and developments in trade talks.

![]() Chart prepared by Matt Simpson - Source: LSEG
Chart prepared by Matt Simpson - Source: LSEG

AUD/USD Technical Analysis: Australian Dollar vs US Dollar
I don’t often like to adopt a neutral bias, but in this case it’s warranted. The Australian dollar is likely to be caught in the crossfire between risk sentiment driven by US–China trade talks, the Fed meeting, and Australia’s quarterly CPI data.
- The most bearish scenario for AUD/USD would involve deteriorating US–China relations, a less-dovish-than-expected Fed cut, and weak Australian inflation.
- The most bullish outcome would stem from successful trade talks ahead of the Trump–Xi summit, a dovish Fed cut, and an upside surprise in Australia’s CPI report.
- Anything in between could see AUD/USD remain range-bound, with false breakouts and sharp reversals a common theme.
From a technical perspective, traders have clear reference levels to monitor: the 200-day EMA (0.6492), monthly S1 pivot (0.6493), 50-day EMA (0.6538), and the descending trendline resistance.
Purely on a technical basis, I anticipate an initial push higher followed by another leg lower.
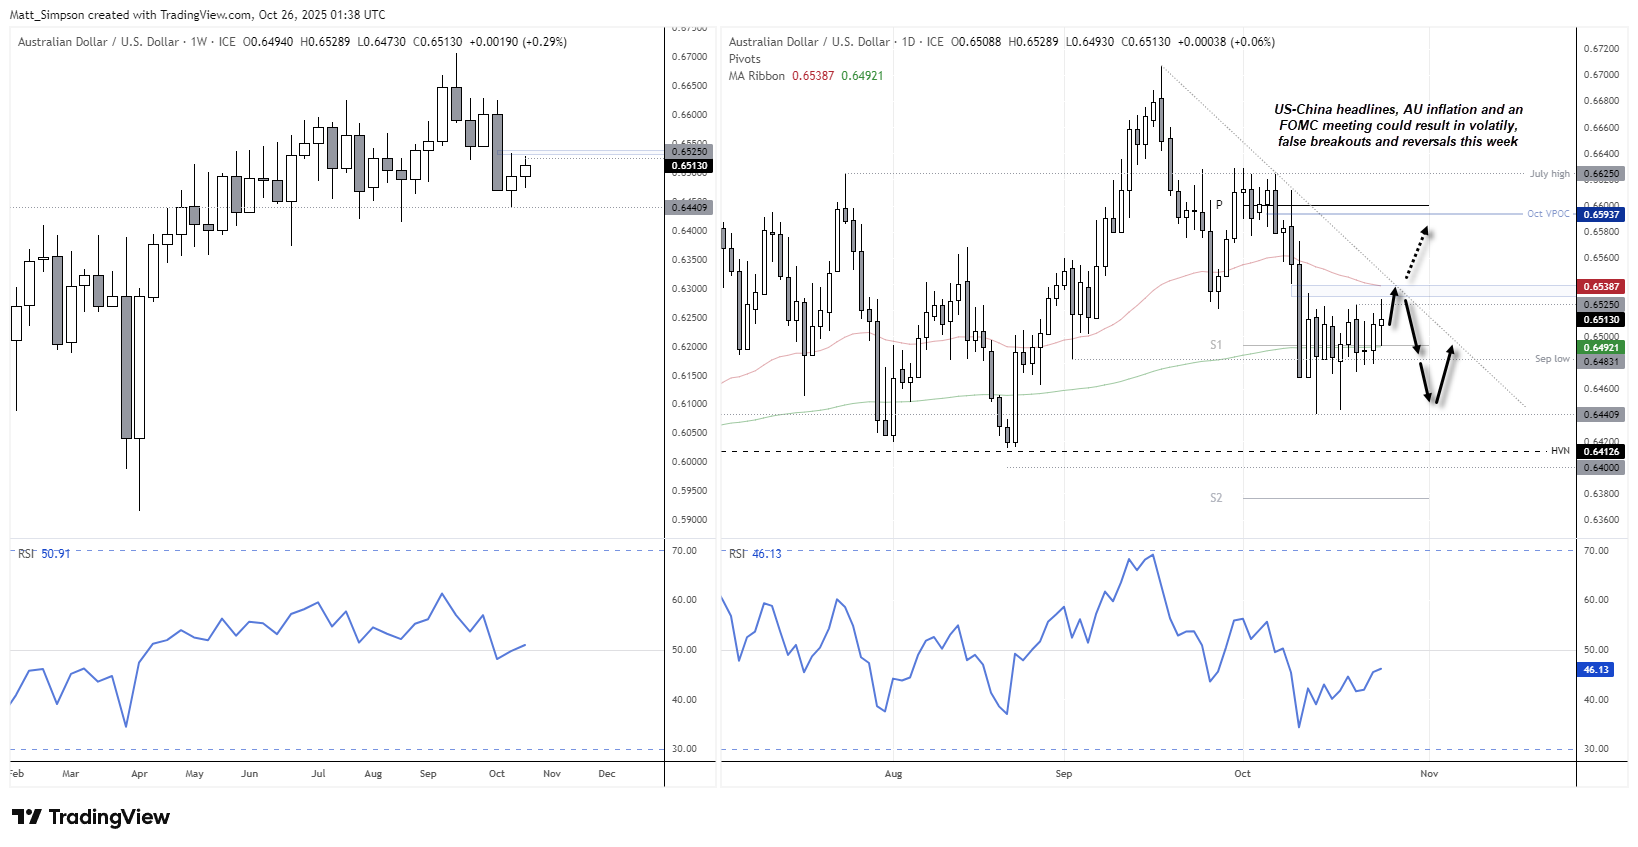
Chart analysis by Matt Simpson - data source: TradingView AUD/USD
View the full economic calendar
-- Written by Matt Simpson
Follow Matt on Twitter @cLeverEdge
How to trade with City Index
You can trade with City Index by following these four easy steps:
- Open an account, or log in if you’re already a customer
• Open an account in the UK
• Open an account in Australia
• Open an account in Singapore
- Search for the market you want to trade in our award-winning platform
- Choose your position and size, and your stop and limit levels
- Place the trade


