


The Australian dollar extended gains across the board last week, supported by stronger risk appetite, reduced expectations of RBA cuts, and growing confidence in back-to-back Fed cuts by December. AUD/USD broke higher as anticipated, reaching its most bullish level since November, while AUD/CAD climbed to a 10-month high. AUD/NZD is testing key resistance at the November and February highs, and AUD/JPY advanced to a 6-month peak.
When a currency strengthens broadly across the majors on shifting monetary policy expectations, it often signals the potential for further upside—at least in the near term.
View related analysis:
- ASX 200 and Nikkei 225 Analysis: Technicals and COT Outlook
- AUD/USD, AUD/NZD, NZD/USD Price Action Setups
- AUD/USD Weekly Outlook: Australian Dollar Bulls Eye Breakout of 66c

Chart prepared by Matt Simpson, data source: LSEG
Fed Cuts, FOMC Projections Eyes: Powell Balancing Political Pressure With Market Stability
There has been growing speculation that the Fed could deliver a 50bp cut at this week’s FOMC meeting. The deterioration in employment data may well justify such a move, but I suspect pride will prevail and the Fed will fall short with a 25bp cut. Given the political heat Powell has faced from the Trump administration, a 50bp cut could vindicate the President’s stance that the Fed has been too slow to ease, while also risking unnecessary panic across markets. A 25bp cut, on the other hand, allows the Fed to toe the party line while still maintaining an appearance of independence.
Futures Market Pricing: 25bp in September, More to Come
Fed Funds futures imply a 96.4% chance of a 25bp cut, and around 80% odds of further 25bp cuts in October and December. Expectations for additional cuts from March are all below 50%, making this week’s meeting a key opportunity for the Fed to reshape the outlook via the updated Staff Economic Projections (SEP) and Powell’s press conference.
AUD/CAD Bulls Eye 0.94 on Dovish BoC Outlook
The Bank of Canada (BoC) is also expected to cut by 25bp, with weak July and August employment figures reinforcing the case. Swaps currently imply an 84% probability of such a move. A dovish delivery could see AUD/CAD bulls extend their breakout toward the 0.94 handle.

Chart prepared by Matt Simpson, data source: Investing.com
With the RBA having delivered its token rate cut while growth and inflation exceeded expectations, there is little reason to expect any major sentiment shift in Westpac’s quarterly consumer sentiment report. A glance at city restaurants hardly suggests concerns of recession or a notable dip in employment, so another set of robust jobs figures is likely in Thursday’s labour force report.
Assuming the Fed delivers a 25bp cut without triggering panic, the Australian dollar could continue to thrive in a weak US dollar environment, supported further by rising risk appetite.
AUD/USD Correlations
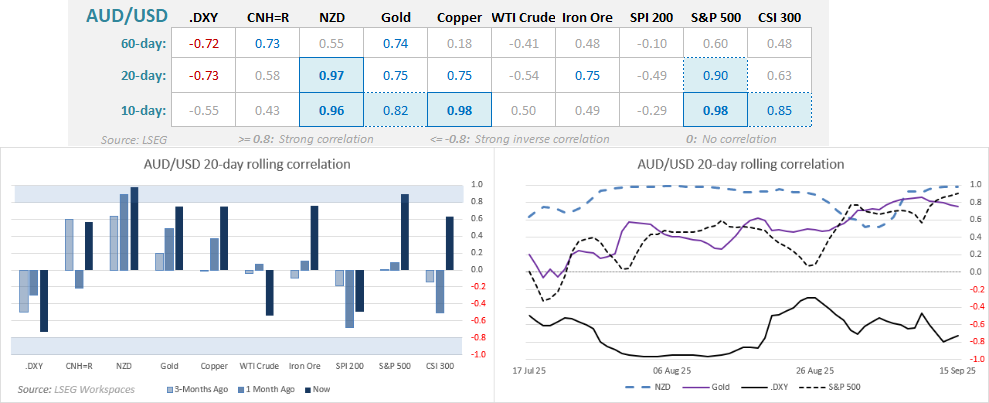
Chart prepared by Matt Simpson, data source: LSEG
AUD/USD Futures Positioning – COT Report
Only minor adjustments were made to Australian dollar positioning last week.
- Large speculators reduced their net-short exposure for a second week, by -3.5k contracts. This came as 2.5k long contracts were added (+8.5%) and 1k shorts were trimmed (-0.8%).
- Asset managers increased their net-short exposure by 2.3k contracts, adding 398 longs (+1%) but also 2.7k shorts (+2.5%).
As the data only covers positioning up to last Tuesday, it does not capture the 1.3% AUD/USD rally on Wednesday and Thursday driven by US dollar weakness. Net-short exposure is therefore likely to have decreased further.
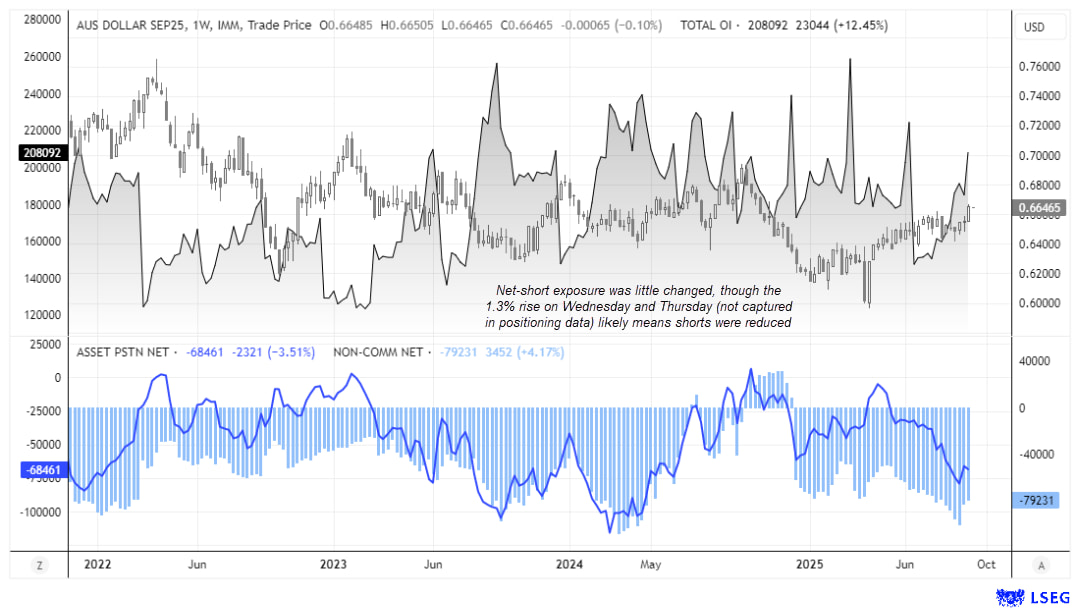
Chart prepared by Matt Simpson, data source: LSEG
AUD/USD Implied Volatility, Risk Reversals Support Australian Dollar Rally
Implied volatility has been trending lower on AUD/USD for several months. While this could signal growing complacency and leave the Australian dollar vulnerable to a shock, for now it is laying the groundwork for a constructive bullish trend.
This view is also supported by the options market, with 1-week and 1-month risk reversals rising in line with spot prices, confirming the bullish bias. Although risk reversals for AUD/USD remain negative—meaning puts (bearish bets) still outweigh calls (bullish bets) in absolute terms—the upward trend shows that demand for calls is increasing on a relative basis.

Chart prepared by Matt Simpson, data source: LSEG
AUD/USD Technical Analysis
Australian dollar bulls enjoyed the bullish breakout I had been anticipating last week. The fact that it followed a shallow, multi-week retracement suggests we may be at the early stages of the next leg higher.
That said, bulls should watch the 0.6677 area, where the 200-week SMA and EMA converge to form likely near-term resistance. I suspect any pullback could be shallow, with buyers looking to step in on dips to drive AUD/USD toward the weekly VPOC at 0.6733.
The bias remains bullish while prices hold above the 0.6580 low, with the July high (0.6625) also acting as short-term support. A sustained break above 0.6677 would open the way for a run at 0.6900 and the 2024 high at 0.6942.
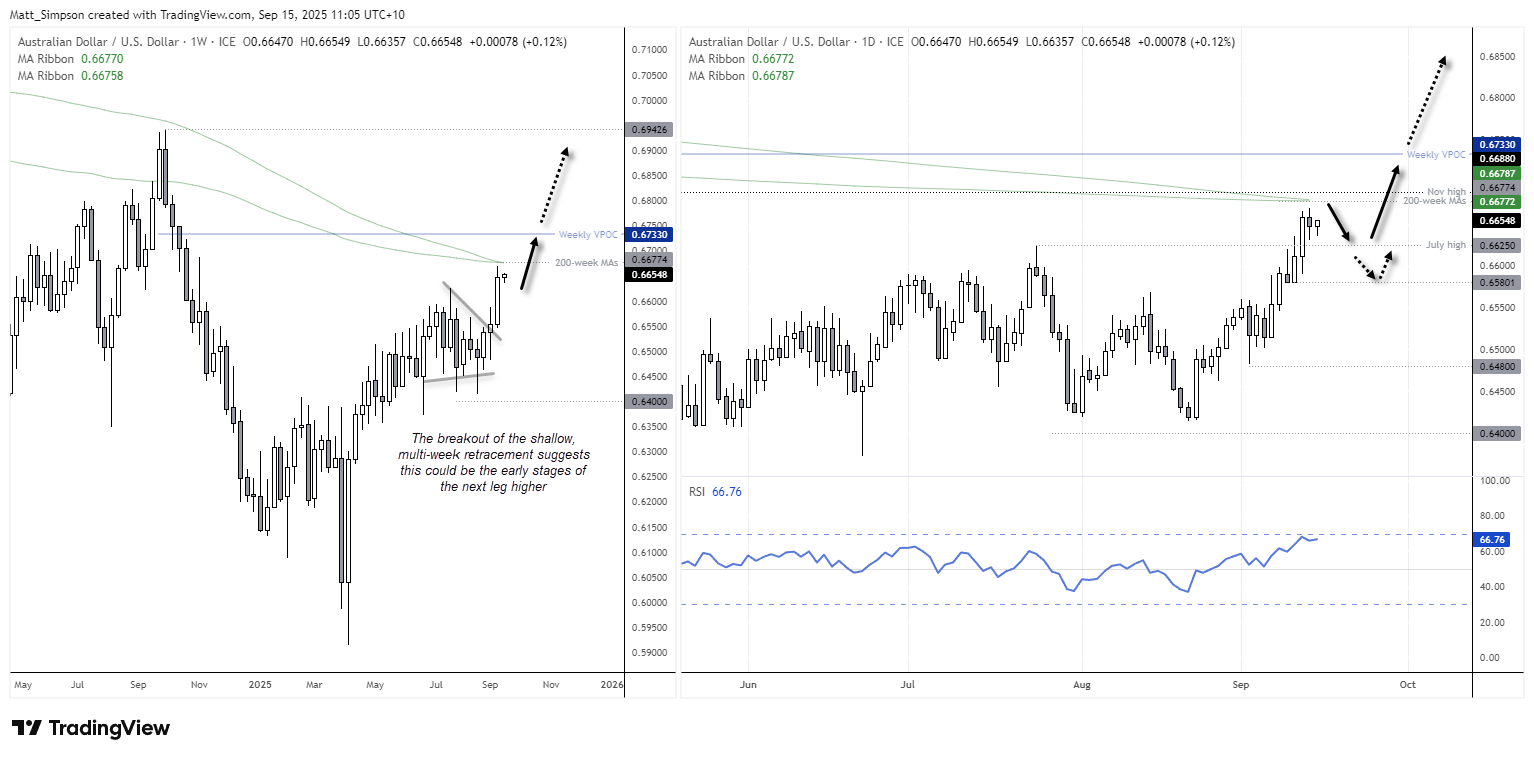
Chart analysis by Matt Simpson - data source: TradingView AUD/USD
View the full economic calendar
-- Written by Matt Simpson
Follow Matt on Twitter @cLeverEdge
How to trade with City Index
You can trade with City Index by following these four easy steps:
- Open an account, or log in if you’re already a customer
• Open an account in the UK
• Open an account in Australia
• Open an account in Singapore
- Search for the market you want to trade in our award-winning platform
- Choose your position and size, and your stop and limit levels
- Place the trade


