


The Australian dollar is showing early signs of fatigue near recent highs, with AUD/USD struggling to extend gains despite a broadly supportive macro backdrop. While policy divergence with the Federal Reserve continues to underpin the pair, softer RBA hike expectations and looming global risk events leave the Aussie vulnerable to near-term pullbacks.
View related analysis:
- CAD/JPY Outlook Ahead of Canada Jobs and Trump Tariff Ruling
- AUD/USD Hints at Pullback as US Dollar Bulls Regain Footing
- AUD/USD 2026 Outlook: Policy Divergence and a Shifting Dollar Trend
AUD/USD Outlook: Momentum Signals Fade Near Recent Highs
US Supreme Court Tariff Ruling in Focus
The US Supreme court are yet to decide whether Trump’s tariffs are legal, though their review of the matter began on Friday. There is no knowing when they might make their decision, but it could impact appetite for risk and therefore the Australian dollar when the headlines drop. I personally find it difficult to see them effectively cancelling the tariffs – though that could give appetite for risk quite a boost. It seems more likely they will remain in place or be handed over to congress. While this could knock sentiment over the short term, any shock of these tariffs has likely run its course and therefore already likely priced in.
RBA Rate Outlook Hinges on Jobs and Inflation
The odds of the RBA hiking by 25bp to 3.85% in February sit at 25%, down from 34% ahead of Christmas. That probability is unlikely to shift much this week, with only consumer confidence and inflation expectations on the economic calendar.
Next week’s jobs report, followed by the quarterly and monthly inflation prints the week after, are more likely to determine whether the RBA pulls the trigger.
Fed Policy Path Keeps USD in Check
Meanwhile, Fed funds futures suggest rates will remain on hold for the next three meetings, with a 47% chance of a cut priced for June and 34.5% for September. Friday’s nonfarm payrolls report did little to shift interest rate odds, with the US economy adding 50k jobs in December and unemployment falling to 4.4%.
This policy divergence should help AUD/USD retain a bid overall unless bears are handed a genuine risk-off catalyst.

Australian Dollar Performance
- It was a mixed week for the Aussie, with AUD/USD closing effectively flat after a brief break above 67c.
- The Australian dollar made its strongest gains against the Canadian dollar, with AUD/CAD rising 1.16% and trading above 0.93 for the first time since September.
- GBP/AUD fell for a third consecutive week and is trading around the 2.00 handle, with bears eyeing a break below the November low at 1.996 to extend the downtrend.
- The euro continues to lead sterling lower, with EUR/AUD sliding to an eight-month low.
- AUD/NZD rose for a second week, pushing the cross to a 10-year high, with bulls now targeting a break above 1.17.
- A weaker Japanese yen lifted AUD/JPY to a six-month high, with the daily trend tracking neatly along the 10-day EMA. A bullish engulfing pattern formed at the average on Friday, offering little sign of meaningful pullbacks so far.
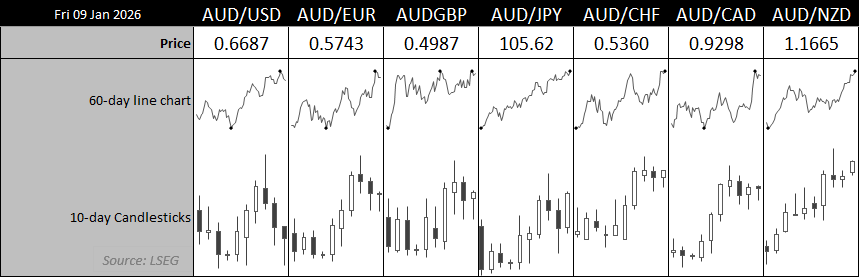
Chart prepared by Matt Simpson - Source: LSEG
Australia This Week: Economic Data and Events for AUD/USD Traders
|
Date |
AEDT (GMT +11) |
Event |
|
Mon 12 Jan |
11:30 |
AU ANZ Job Advertisements (MoM) (Dec) |
|
Tue 13 Jan |
04:45 |
FOMC Member Barkin Speaks |
|
|
05:00 |
US 10-Year Note Auction |
|
|
08:00 |
NZ NZIER Business Confidence (Q4) |
|
|
10:00 |
US FOMC Member Williams Speaks |
|
|
10:30 |
AU Westpac Consumer Sentiment (Jan) |
|
|
22:00 |
US NFIB Small Business Optimism (Dec) |
|
Wed 14 Jan |
00:15 |
US ADP Employment Change Weekly |
|
|
00:30 |
US Core CPI (Dec) |
|
|
08:00 |
US FOMC Member Barkin Speaks |
|
|
17:30 |
CN Trade Balance (Dec) |
|
Thu 15 Jan |
00:30 |
US Core PPI (Nov), Retail Sales (Nov) |
|
|
11:00 |
AU MI Inflation Expectations (Jan) |
|
Fri |
00:30 |
US Jobless Claims |
AUD/USD Correlations
The strongest correlation with the Australian dollar remains NZD/USD. However, with the 10-day inverse correlation with the US dollar index rising towards -0.6, the typically stronger USD relationship is likely to reassert itself on the industry-standard 20-day measure.
WTI crude oil currently shows an inverse relationship with AUD/USD, although this could flip back into positive territory if geopolitical risk escalates — particularly in the event of regime change in Iran.

Chart prepared by Matt Simpson - Source: LSEG

Australian Dollar Futures Market Positioning – COT Report
Longs have continued to step into the Aussie, with asset managers cutting their net-short exposure to AUD/USD futures by around 50% in a matter of weeks. Large speculators remain just under 19k net short – their least bearish level since flipping to net-short exposure in December 2024. Asset managers are net short by -31.3k contracts, their least bearish level since May.
Given I am bullish the Australian dollar this year, I suspect we could be looking at AUD/USD flipping to net-long exposure possibly as early as Q2.
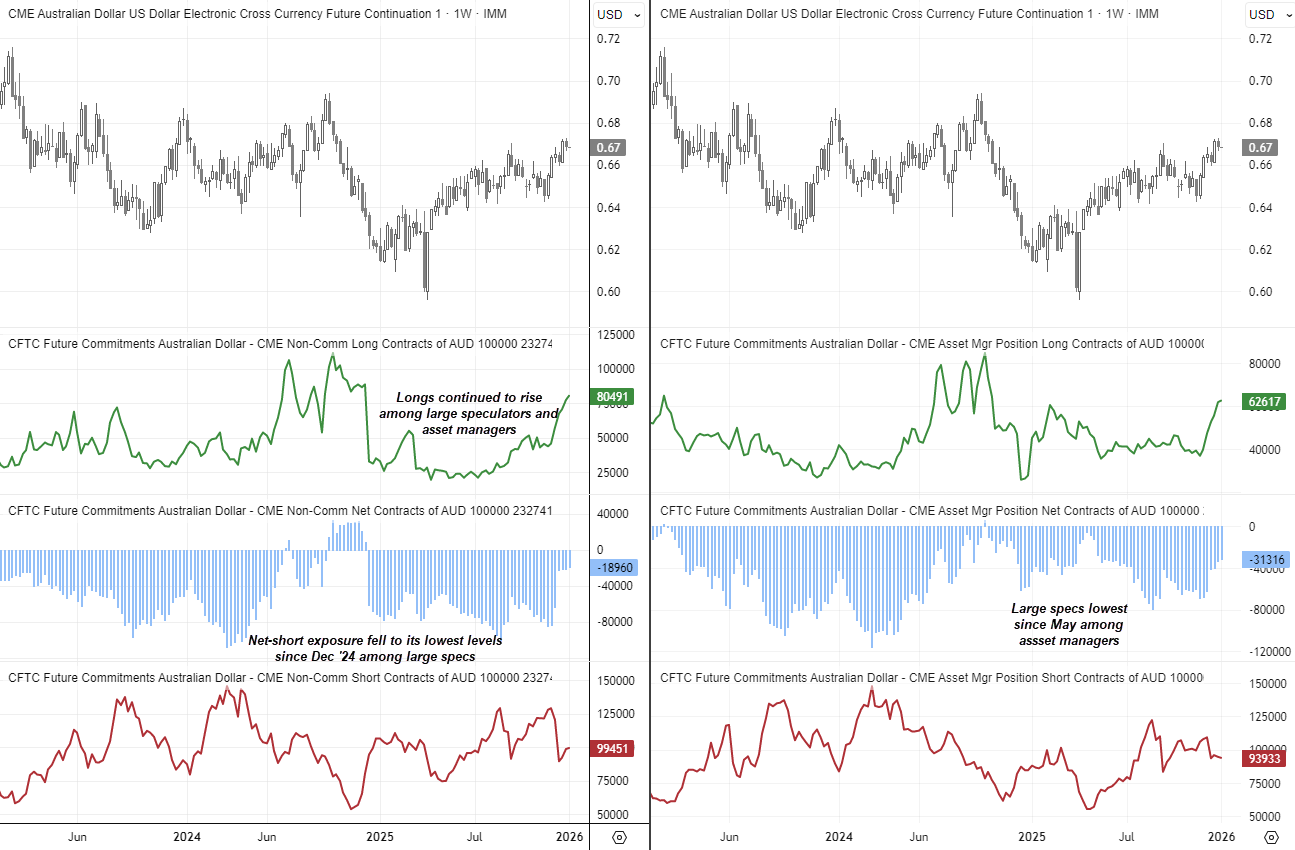
Chart prepared by Matt Simpson - Source: CME, LSEG
AUD/USD Technical Analysis: Australian Dollar vs US Dollar
Bulls enjoyed a decent Santa rally, with AUD/USD rising 1.9% in December, although the pair gained 5.4% from the November low to the January high. While AUD/USD briefly traded above 0.6760 on Friday, the shooting star candle into the close — and failure to hold above the October VPOC — warns of near-term trend exhaustion.
It is also worth noting that Australian bond yields are flashing near-term bearish signals, which could feed into a pullback in AUD/USD.
A move towards the monthly pivot (0.6645) and December VPOC (0.6636) looks plausible and may entice dip buyers. However, the economic calendar does not appear strong enough to justify a sustained break above last week’s high. That said, such a move could materialise if the US Supreme Court delivers a risk-positive surprise by ruling Trump’s tariffs illegal.
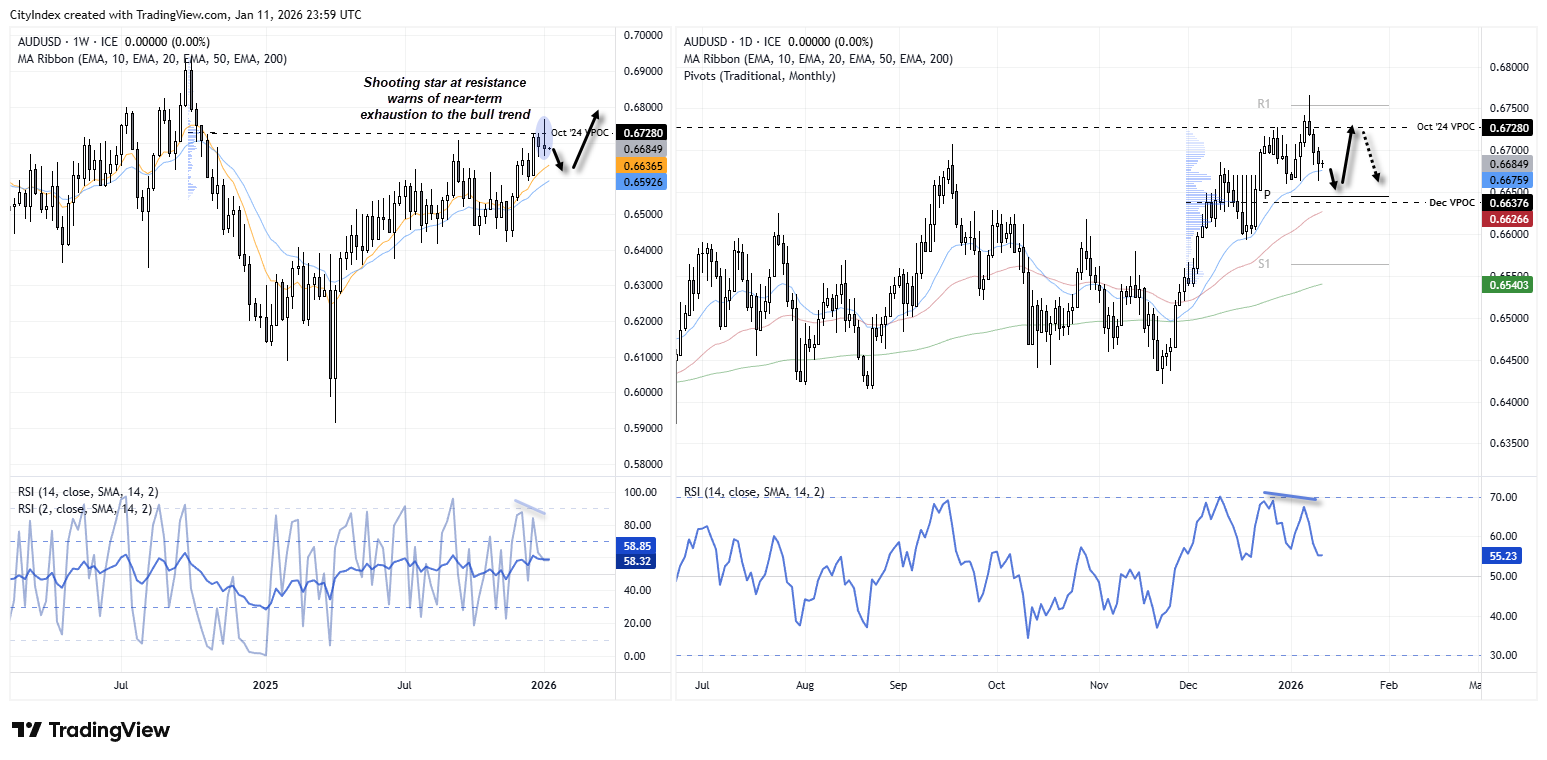
Chart analysis by Matt Simpson - data source: TradingView AUD/USD
View the full economic calendar
-- Written by Matt Simpson
Follow Matt on Twitter @cLeverEdge
How to trade with City Index
You can trade with City Index by following these four easy steps:
- Open an account, or log in if you’re already a customer
• Open an account in the UK
• Open an account in Australia
• Open an account in Singapore
- Search for the market you want to trade in our award-winning platform
- Choose your position and size, and your stop and limit levels
- Place the trade


