
AUD/USD has enjoyed a strong start to the year, climbing for a fourth consecutive week and briefly trading more than 20% above its April low. However, signs of fatigue are emerging.
Upper wicks on the weekly chart, stretched momentum readings and rising geopolitical risks suggest upside may become harder to sustain. With both RBA and Fed expectations finely balanced, the rally risks turning into chop at the top rather than extending cleanly higher.
View related analysis:
- GBP/AUD Slumps to 13-Year Low as RBA–BoE Divergence Widens
- Australian Dollar Outlook: Rates Lead AUD/USD, Options Signal Risk
- FX Futures Positioning: US Dollar, EUR/USD, USD/CAD | COT report
- Nasdaq 100 Leads Risk-Off as Tech Earnings Weigh, Gold Slides
Australian Dollar Performance
It was a solid start to the week for the Australian dollar, rising against most major peers except the Japanese yen (JPY) and Swiss franc (CHF). However, the Aussie surrendered at least half of those gains during late-week risk-off trade, hinting at potential trend exhaustion.
AUD/USD rose for a fourth consecutive week and traded as much as 20.8% above its April low before pulling back ahead of its 2023 high.
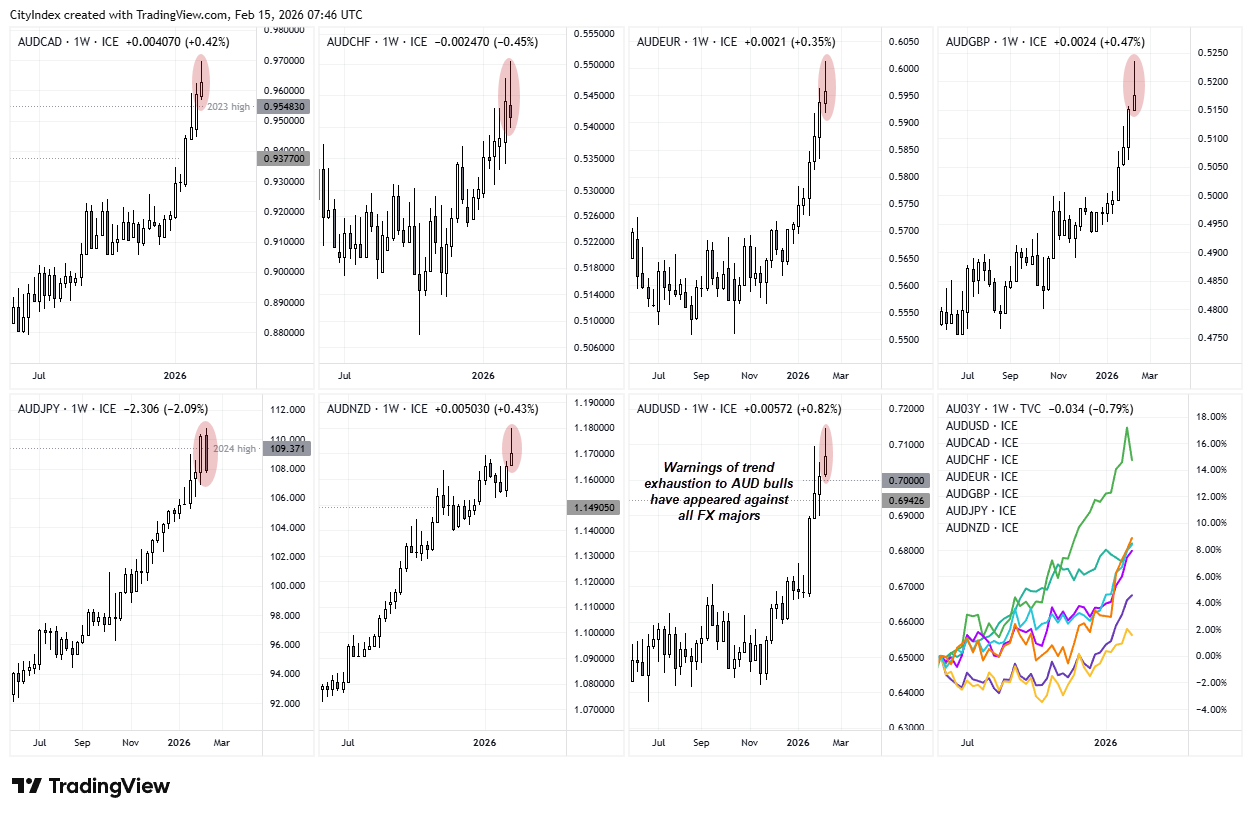
Source: TradingView
- AUD/JPY provided the clearest sign of exhaustion, forming a prominent two-week bearish reversal pattern (a dark cloud cover) and closing back beneath its 1991 and 2024 highs.
- AUD/CHF formed a hammer candle around its March low.
- AUD/CAD reversed almost perfectly at 0.97.
- AUD/NZD stalled at 1.18 before reversing and forming a shooting star candle, closing just above 1.17.
- GBP/AUD reached my interim downside target near its October 2024 low. While a bullish hammer warns of trend exhaustion after its sixth consecutive week lower, an eventual move towards 1.80 remains on the cards later this year.
- EUR/AUD fell for an eighth consecutive week — its worst run in ten years — although a bullish hammer now warns of potential exhaustion.

Australia This Week: Economic Data and Events for AUD/USD Traders
RBA Minutes, Wage Price Index and the Labour Force report headline the domestic calendar, while U.S. data and Fed speakers could prove just as influential for AUD/USD.
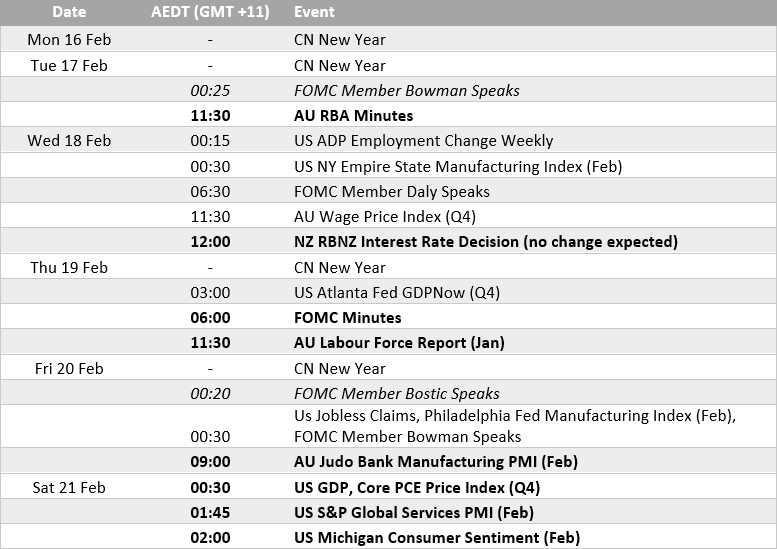
RBA Minutes Unlikely to Deliver Fresh Hawkish Surprises
The RBA Minutes may help refine expectations around further tightening, but they are unlikely to deliver materially new information.
Markets already understand the Board retains a tightening bias if inflation proves persistent. Updated forecasts imply scope for additional hikes this year, and Governor Bullock has reiterated that 3% inflation remains “unacceptable.”
Unless the minutes reveal a stronger internal push for immediate tightening, they may not meaningfully shift rate pricing.

Australia PMIs Trending Higher
Flash PMIs are due Friday at 09:00 AEDT. While not always major AUD/USD movers, their policy implications are growing more relevant.
Manufacturing, services and composite PMIs are expanding at a faster pace, and their 12-month averages continue trending higher. That supports the narrative of resilient growth and sticky inflation — factors that could keep the RBA cautious about easing.
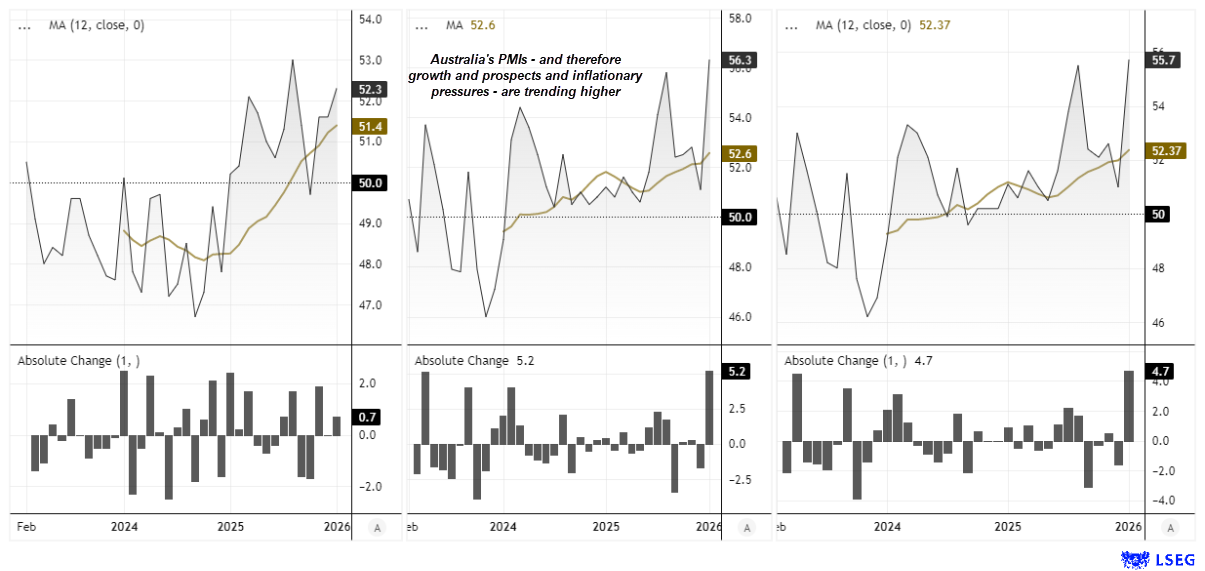
Source: Judo Bank, S&P Global, LSEG
FOMC Minutes, PMIs and Geopolitical Risk in Focus
FOMC minutes may fine-tune expectations around the Fed’s appetite for cuts. However, with only a 51.8% probability of a 25bp cut in June (CME FedWatch), incoming data remains the dominant driver.
S&P Global flash PMIs will provide a forward-looking read on growth. January’s readings were slightly softer than expected, but both sectors remained in expansion. That suggests Q4 advance GDP is unlikely to deteriorate sharply.
The University of Michigan sentiment survey has also rebounded from recent lows. Overall, U.S. data does not strongly justify imminent Fed cuts, leaving the U.S. dollar exposed to upside surprises.
Outside the data calendar, geopolitical headlines — particularly surrounding Iran — could inject volatility. Risk-off flows would likely weigh on the Australian dollar, especially given technical signs of a maturing rally.
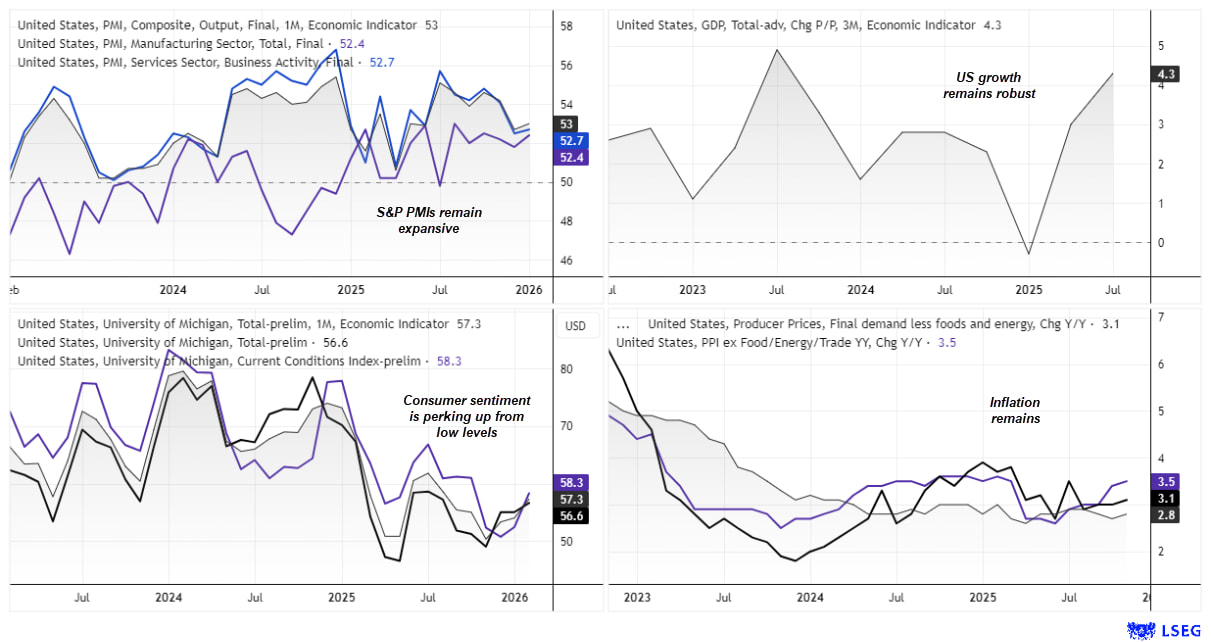
Source: LSEG
AUD/USD Futures Positioning | COT Report
Futures positioning turned more constructive for a third week. Large speculators lifted net-long exposure to a 16-month high, while asset managers trimmed net shorts to a nine-month low.
However, gross long and short exposure declined across both groups, suggesting conviction may be fading. Combined with shooting star candles on the weekly chart, positioning signals the rally may be losing momentum.
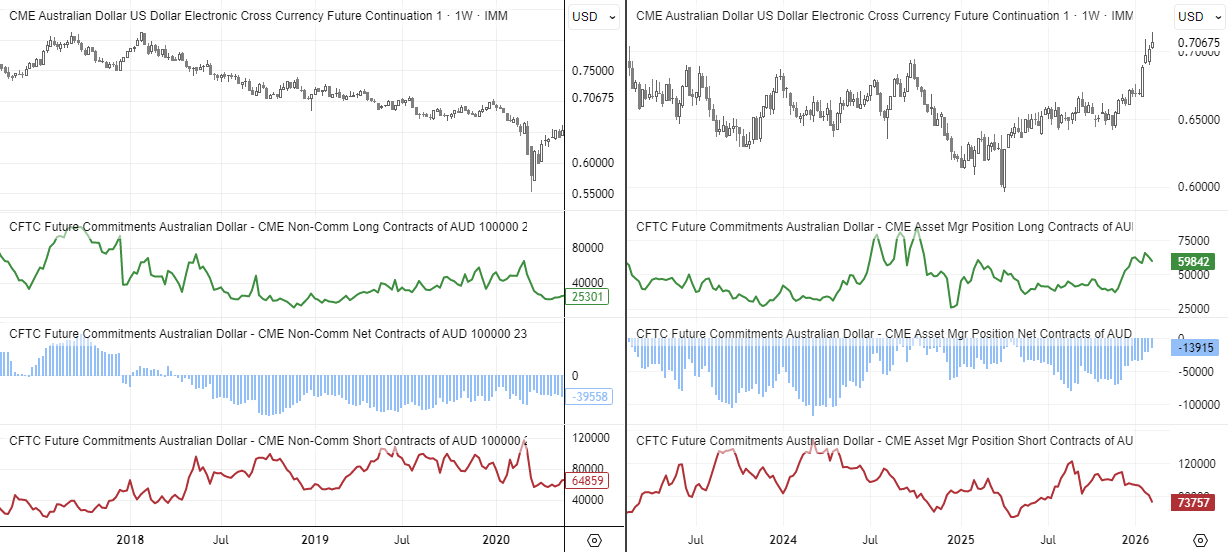
Source: CFTC, CME, LSEG
AUD/USD Technical Analysis: Australian Dollar vs US Dollar
Upside may be limited near term. Upper weekly wicks following an extended rally typically signal hesitation, while RSI remains stretched.
0.7000 aligns closely with the weekly S1 pivot and stands as initial support ahead of the 2024 high near 0.6950. A sustained break below 0.6950 would suggest a deeper correction, though bears have yet to show decisive momentum.
On the topside, rallies toward the 2023 high may attract sellers unless the U.S. dollar enters a renewed downtrend.
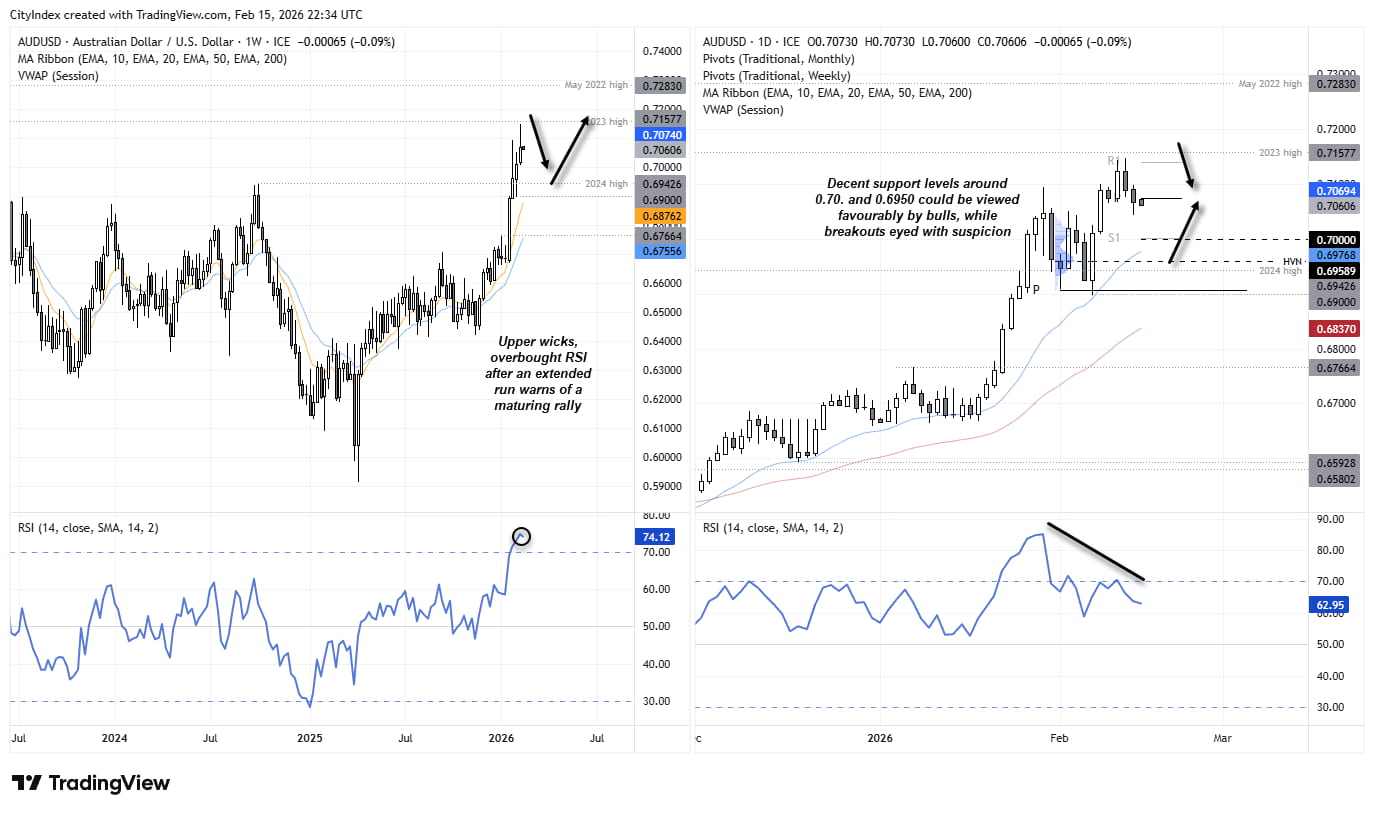
Source: TradingView
View the full economic calendar-- Written by Matt Simpson
Follow Matt on Twitter @cLeverEdge
How to trade with City Index
You can trade with City Index by following these four easy steps:
- Open an account, or log in if you’re already a customer
• Open an account in the UK
• Open an account in Australia
• Open an account in Singapore
- Search for the market you want to trade in our award-winning platform
- Choose your position and size, and your stop and limit levels
- Place the trade