
The Australian dollar endured a volatile week, sliding sharply on Friday as renewed U.S.–China tariff tensions triggered a global risk-off move. President Trump’s 100% tariff threat reignited trade-war fears and hit commodity currencies hard, though the market reaction suggests traders doubt the escalation will stick. With U.S. data releases frozen by the government shutdown and Australia’s labour market showing fresh cracks, AUD/USD remains vulnerable to downside pressure in the near term.
View related analysis:
- Nasdaq, Crude Oil Plunge Amid Trump-Tariff Revival as Gold Holds Firm
- Japanese Yen Selloff Losing Steam, AUD/JPY and AUD/USD Bears Resurface
- New Zealand Dollar Sinks After RBNZ’s Dovish 50 bp Cut
- AUD/USD, NZD/USD and AUD/NZD Outlook Ahead of RBNZ Decision
Trump’s Tariff Threat, Weak Consumer Sentiment Hits the Australian Dollar
The Trump-tariff theme has reared its ugly head once again, sparking a bout of volatility and risk-off sentiment on Friday that saw the Australian dollar fall 1.7% by the close. President Trump threatened China with an additional 100% tariff on its goods in response to Beijing’s newly announced rare-earth export controls. Given the US imports roughly 80% of its rare earths from China, Beijing has struck the US where it hurts.
While the direct impact on Australia is limited, fears of a global slowdown and renewed trade-war tensions tend to weigh on commodity currencies such as the Aussie. Still, the fact that AUD/USD fell only 1.7% suggests markets aren’t taking this round of tariff threats too seriously — especially with TACO in mind (“Trump Always Chickens Out”).
Earlier in the week, the Australian dollar was already under pressure as the US dollar extended its bullish run, Wall Street experienced a brief risk-off wobble, and consumer confidence weakened in Australia. According to the Westpac–Melbourne Institute survey, consumer sentiment fell to a six-month low — down 6.5% over the past two months — effectively reversing all the optimism gained since the RBA’s last rate cut.

AUD/USD Implied Volatility Spikes, Risk-Reversals Move Lower
Still, the 1-week and 1-month annualised implied volatility level rose to a 3-month high on Friday, while AUD/USD endured its worst day since April, just like Wall Street indices. Risk-reversals fell to a 4-month low to show a rise of bearish bets against the Australian dollar. Given the rise of realised and expected volatility, AUD/USD is vulnerable top whipsaws amid US-China headlines this week.
Ultimately, traders may want to remain nimble and investors allow plenty of wriggle room for choppy, two-way trade.

Chart analysis by Matt Simpson, Source: LSEG
US Economic Data? Not So Fast…
We’re now roughly 10 days into the US government shutdown, which makes it longer than usual — though not as bad as the 35-day shutdown from December 2018 to January 2019. That means the US economic data schedule is shot to pieces. Not only are high-level government releases such as nonfarm payrolls paused indefinitely, but also third-party reports (such as from the Census Bureau) that rely on government inputs to calculate their data series.
Even if the government were to reopen this week, there will be bottlenecks to clear, and data will be released sporadically. Using history as our guide, weeks two to three after reopening are when we can expect a staggered backfill of data, while weeks four and beyond are when we begin to see data normalisation. Which is a shame because we would have had NFP and CPI data to mull over ahead of this month’s Fed meeting. And the lack of data brings into question as to whether the Fed really can cut.
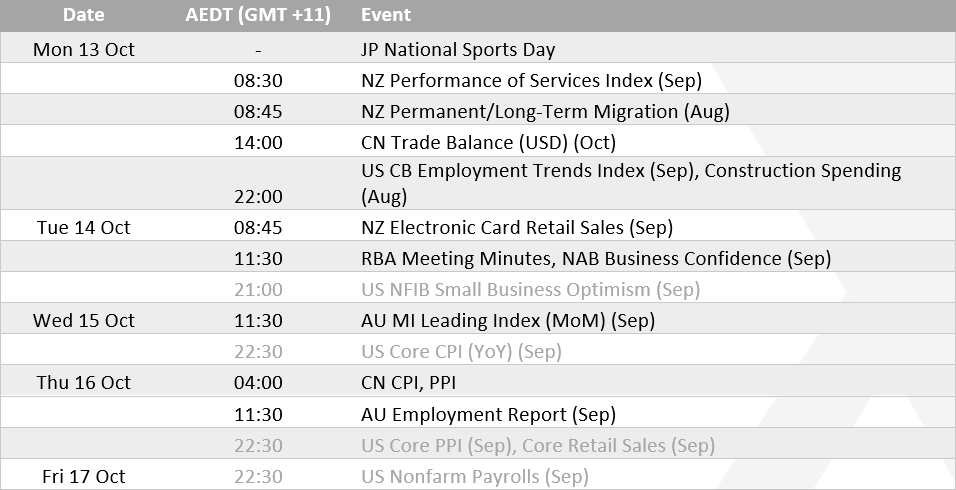
Chart prepared by Matt Simpson - data source: Investing.com

Australian Employment Softens as RBA Weighs Policy Caution
Australia’s employment situation continues to lose its shine, with unemployment edging higher and the participation rate appearing to have peaked. Full-time employment has fallen by around 40k in two of the past three months, marking the second contraction in headline job growth this year — albeit a modest -5.4k. So far in 2025, the cumulative rise in full-time employment stands at 74.9k jobs. Employment is still growing, but clearly at a slower pace than last year.
RBA cash rate futures currently imply a 42% chance of a rate cut at next week’s meeting, a probability that could rise if Thursday’s employment data disappoints. However, if trade war risks resurface, it could give the RBA yet another reason to remain cautious on policy changes. I expect the RBA minutes to maintain their cautious tone, without offering anything new or particularly revealing.
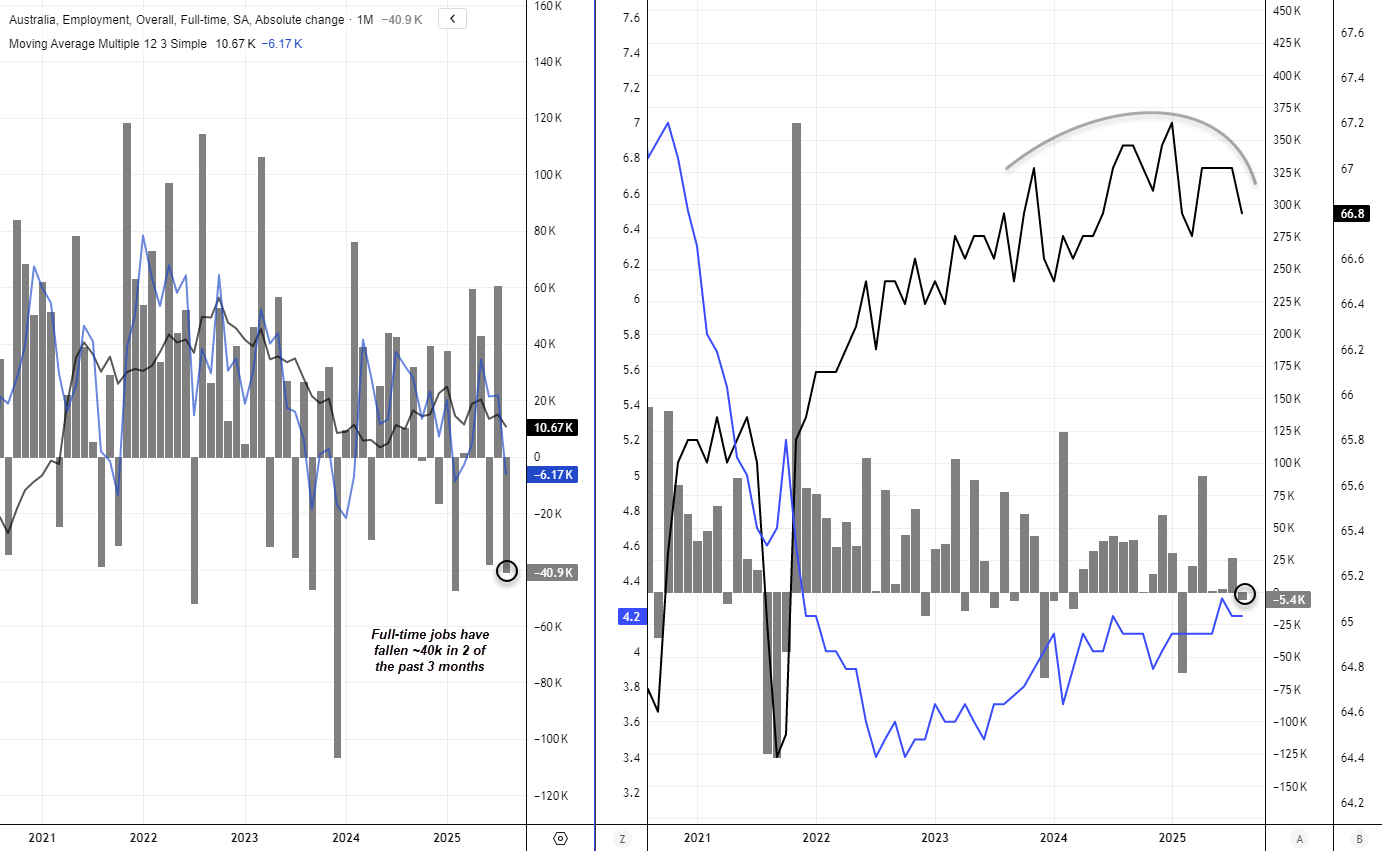
Chart prepared by Matt Simpson - data source: LSEG
AUD/USD Correlations
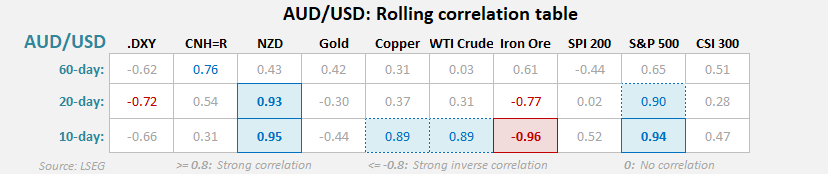
Chart prepared by Matt Simpson - data source: LSEG
AUD/USD Futures Positioning – COT Report
- Large speculators increased their net-short exposure to AUD/USD futures by 8.4k contracts last week, bringing total net shorts to 59.6k contracts.
- Gross shorts rose by 10.1k contracts (+11.1%), while gross longs increased by 1.7k contracts (+4.3%).
- Asset managers also expanded their net-short exposure by 8.4k contracts, driven by a 9% rise in shorts and a 2% reduction in longs.
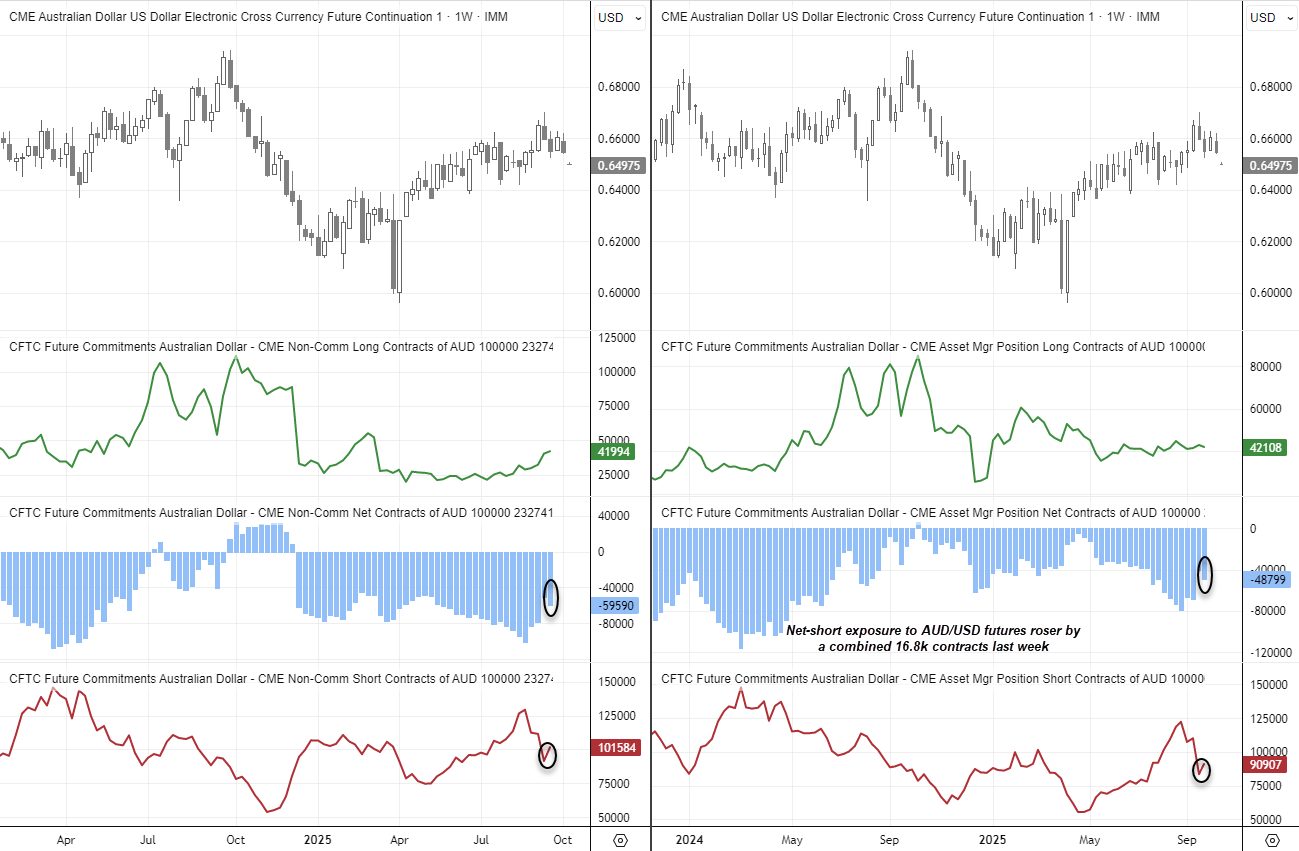
Chart prepared by Matt Simpson - data source: CME, IMM, LSEG
AUD/USD Technical Analysis
Friday’s sell-off saw a daily close below the lower Keltner band — an area the pair rarely spends much time beneath. With AUD/USD bouncing at the open, traders are already questioning how seriously to take Trump’s tariff threat. Still, overall momentum remains firmly to the downside, and bears may look to fade into such bounces.
For now, my bias is for another lower high to form on the AUD/USD daily chart, with bears eyeing the August and July lows near the high-volume node (HVN) just above 0.64.
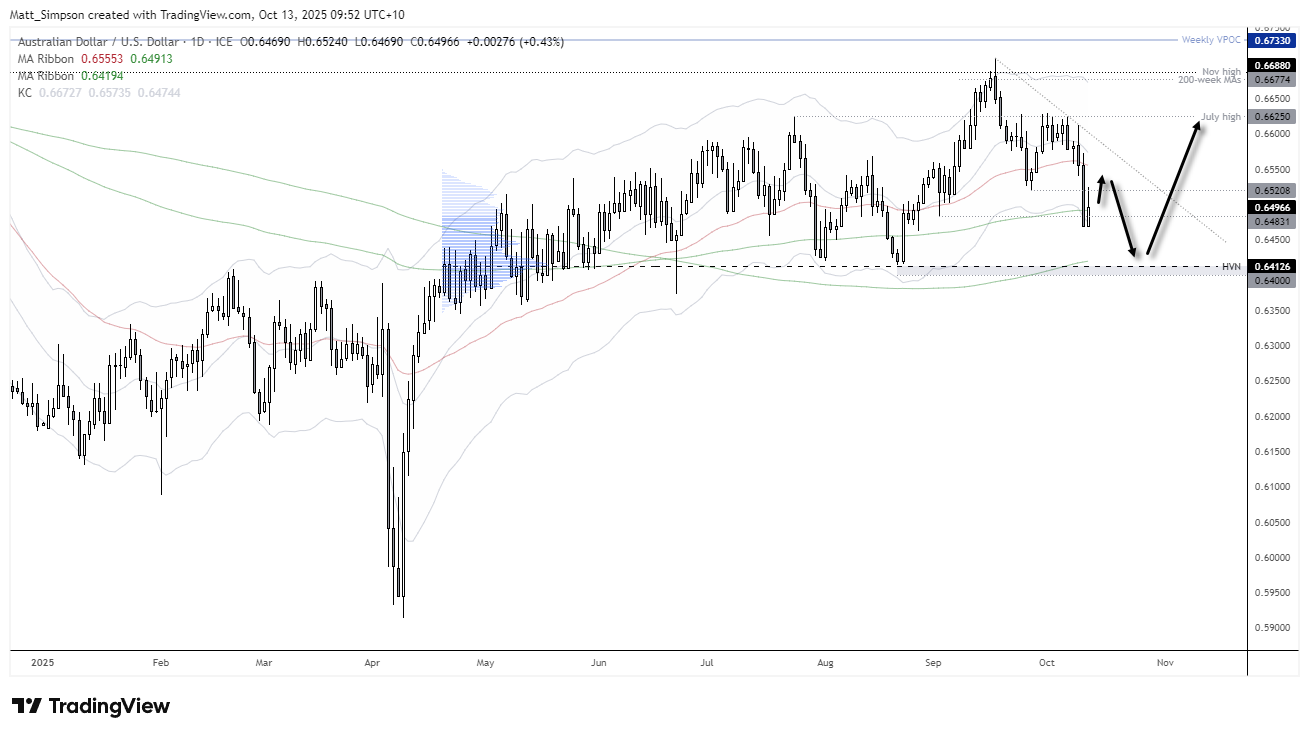
Chart analysis by Matt Simpson - data source: TradingView, AUD/USD
View the full economic calendar
-- Written by Matt Simpson
Follow Matt on Twitter @cLeverEdge
How to trade with City Index
You can trade with City Index by following these four easy steps:
- Open an account, or log in if you’re already a customer
• Open an account in the UK
• Open an account in Australia
• Open an account in Singapore
- Search for the market you want to trade in our award-winning platform
- Choose your position and size, and your stop and limit levels
- Place the trade