


AUD/USD is steady after Australia’s strong employment report reset interest-rate expectations. Markets have largely abandoned the idea of an RBA cut this year, not because policymakers are hawkish, but because the data isn’t giving them room to ease. With no major domestic releases this week, the Australian dollar will take its direction from the US as agencies begin clearing the backlog of delayed reports following the government shutdown.
View related analysis:
- Australian Dollar Jumps, ASX Falls as Strong Jobs Data Fuels RBA Hike Bets
- ASX 200 Slides Further as Tech, Discretionary and Real Estate Crack
- Australian Dollar Price Action Setups: AUD/USD, EUR/AUD, GBP/AUD
- Australian Dollar Outlook: RBA Hold Puts Focus on AU Jobs, US CPI
- Senate Moves to End Longest U.S. Government Shutdown in History
Australian Dollar Outlook: AUD/USD Steadies as Jobs Data Shifts RBA Odds
Australia’s strong employment report poured cold water on the already low expectations of an RBA cut this year. The figures also hinted that a hike could be the next move, though the RBA would need time to prepare the market for such a reversal. Still, the case is building: inflation remains elevated, jobs data is firm, and Q3 home loans hit a record high — particularly among investors.
For now, I suspect the odds of a hike remain slim — but incoming data needs to behave. Odds of a 25bp cut in December have fallen to 8% according to the RBA cash rate futures curve, though they still favour a single cut by mid 2026 in line with the RBA’s latest forecasts.
The RBA minutes are unlikely to reveal much, as the real concerns lie in the data itself. Wage prices are also unlikely to be a major market mover for AUD/USD traders, leaving Australia without any top-tier domestic releases to focus on this week. That places all the emphasis on US data, assuming it arrives.

Economic Data To Pick Up with End of US Government Shutdown
I provide a more detailed timeline on US data separately, but agencies will now begin backfilling the gaps left by the shutdown. It could take at least a few weeks for the data flow to normalise, and errors or revisions should be expected.
With concerns that US growth has softened, the Philadelphia Fed index deserves close attention. It contracted at its fastest pace in six months in September, so any further deterioration could amplify worries — especially with the index expected to rebound to 8.6 from –12.8 previously.
Consumer sentiment has fallen for three straight months according to the University of Michigan survey, while inflation expectations have declined for four. A weak print — particularly alongside another soft Philadelphia Fed result — could revive hopes of a December Fed cut. But recent commentary from Fed officials has already dragged market-implied odds of a December cut down to ~40% from around 65% a couple of weeks ago.
Will the FOMC Minutes Add Anything New?
It’s debatable how much fresh insight the FOMC minutes will offer, given Jerome Powell made it clear at the post-meeting press conference that another rate cut is far from assured. However, he did flag “strongly differing views” among committee members, so the minutes may show how many opposed the 25bp cut and give a clearer read on how unified the voting members really are.

Australian Dollar Performance
- AUD/USD traded in a tight 15-pip open-to-close range between Tuesday and Friday, highlighting a lack of direction, though it still finished the week 0.7% higher thanks to Monday’s rally.
- AUD/JPY closed at a one-year high on the back of a weaker yen, with this key risk barometer finishing the week back above 100.
- AUD/NZD printed a shooting star near 1.16 on Thursday and extended lower on Friday, signalling a pullback. The weekly chart also formed a shooting star, reinforcing the risk of a deeper retracement.
- EUR/AUD posted a mild bearish inside week, downgrading my bias to neutral after several false breaks in both directions.
- GBP/AUD hit my downside target at 2.00, but Thursday’s sharp bullish reversal reduces the likelihood of a move toward 1.9794, so this pair moves to the backburner for now.
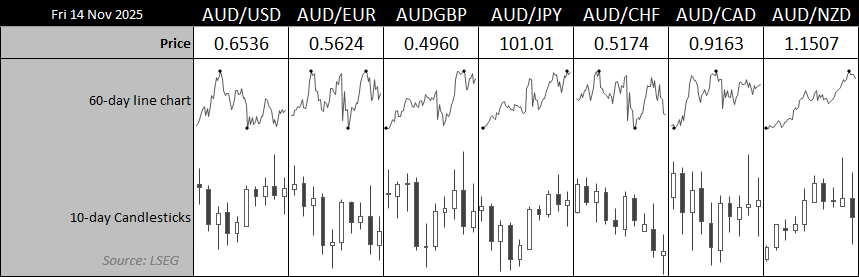
Chart prepared by Matt Simpson - Source: LSEG
Australia This Week: Economic Data and Events for AUD/USD Traders
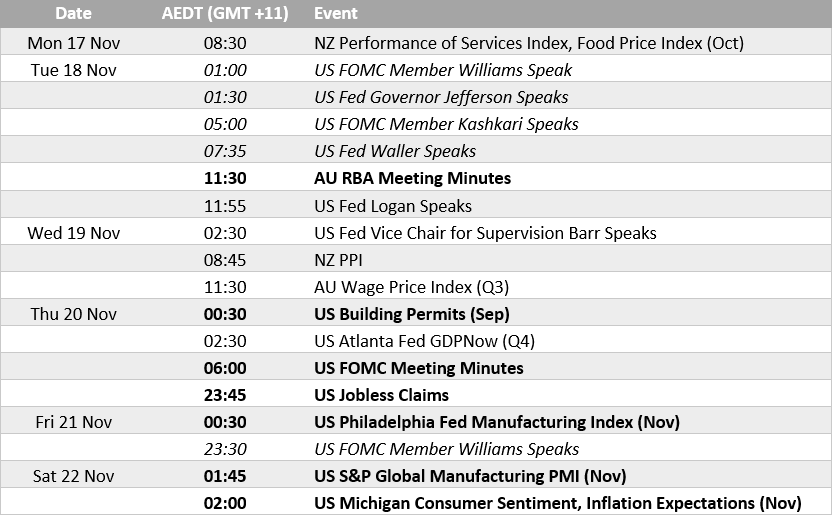
Chart prepared by Matt Simpson - Source: Investing.com
AUD/USD Options Positioning
Implied volatility for the Australian dollar ticked higher last week across the 1-week and 1-month horizons. Volatility has already perked up, given the sharp swings on Thursday and Friday, although AUD/USD ultimately went nowhere directionally. I don’t anticipate any major breakouts this week given the lack of domestic data and the slow drip of US releases.
However, risk reversals still suggest any downside in the Aussie may be limited. My bias therefore remains for an eventual push towards 0.66, with dips likely to stay attractive for buyers.
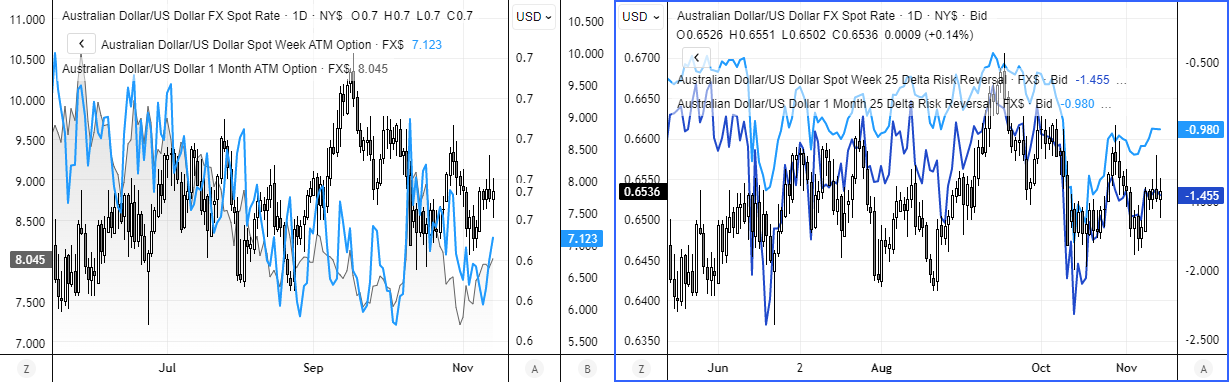
Chart prepared by Matt Simpson - Source: LSEG
AUD/USD Correlations
- The inverse relationship between AUD/USD and the US dollar is evident across the 10-, 20- and 60-day lookbacks, though it isn’t particularly strong on any timeframe.
- The more significant positive correlations are with the New Zealand dollar and copper, with the Kiwi showing the most consistent relationship across all three windows.
- Risk appetite is also clearly in play for the Aussie, given its 10- and 20-day correlations with the S&P 500 sit near 0.7, rising above 0.9 on the 60-day lookback.
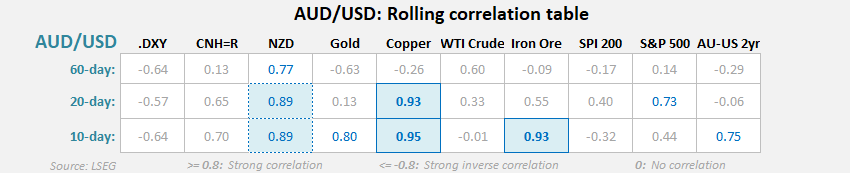
Chart prepared by Matt Simpson - Source: LSEG
AUD/USD Technical Analysis: Australian Dollar vs US Dollar
While volatility cuts both ways last week, I still favour dips on the AUD/USD and for a move towards 66c. Prices remain comfortably above the 200-day EMA despite Friday’s minor selloff, and the spinning top doji didn’t even test the 200-day EMA anyway. AUD/USD also closed above the 100-day EMA every day last week. Furthermore, risk reversals continue to support the Aussie around current prices and hint that dips could be limited.
Bulls could seek dips towards the 200-day EMA on the assumption of a break above last week’s high and run to 66c.

Chart analysis by Matt Simpson - data source: TradingView AUD/USD
View the full economic calendar
-- Written by Matt Simpson
Follow Matt on Twitter @cLeverEdge
How to trade with City Index
You can trade with City Index by following these four easy steps:
- Open an account, or log in if you’re already a customer
• Open an account in the UK
• Open an account in Australia
• Open an account in Singapore
- Search for the market you want to trade in our award-winning platform
- Choose your position and size, and your stop and limit levels
- Place the trade


