


The Australian dollar is under pressure, with AUD/USD falling for a third day after the Federal Reserve’s less-dovish stance triggered renewed strength in the US dollar. Risk reversals show bearish bets building against the Aussie, while implied volatility continues to drift lower. This week’s spotlight is on Australia’s CPI and flash PMIs, alongside US PCE inflation, all of which could determine whether AUD/USD extends its retreat or finds support.
View related analysis:
- ASX 200 Outlook: RBA to Stay Cautious After Softer Employment Report
- US Dollar Reverses Post-Fed: AUD/USD, GBP/AUD in Focus for AU Jobs, UK CPI
- Australian CPI Data Supports RBA’s Cautious Approach on Rate Cuts
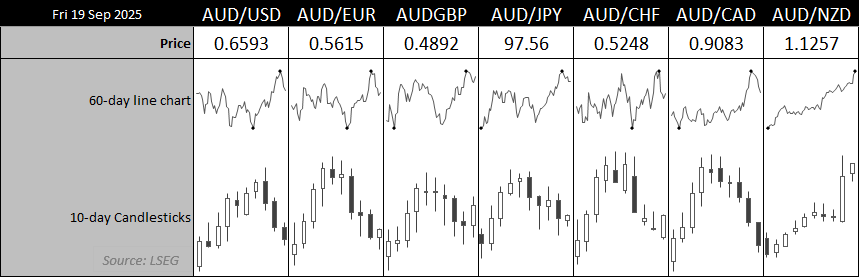
Chart prepared by Matt Simpson - data source: LSEG
- AUD/USD extended losses for a third straight day after a less-dovish-than-expected FOMC meeting, with risk reversals showing a rise in bearish bets over bullish ones.
- Implied volatility continues to trend lower for the Australian dollar.
- Wednesday’s inflation report will be key to determining whether last month’s rise was driven mainly by temporary factors or broader price pressures.
- Flash PMIs and US PCE data are additional events to watch.

Australian PMIs Signal Expansion Ahead of Inflation Data
Australia’s flash PMIs for September are due on Tuesday. While they are not usually a major market mover, they continue to show the economy in expansionary territory. July’s services report highlighted the steepest increase in activity in more than three years, alongside gains in employment, business activity, exports, and the forward-looking future activity index. Domestic and external demand are both improving.
Price pressures remained elevated in July but showed signs of easing. If this trend is repeated in the August data, it could raise hopes for a softer CPI reading in Wednesday’s monthly inflation release. That said, last month’s inflation surprise to the upside leaves open the question of whether it was a temporary blip or the start of a new inflationary phase.
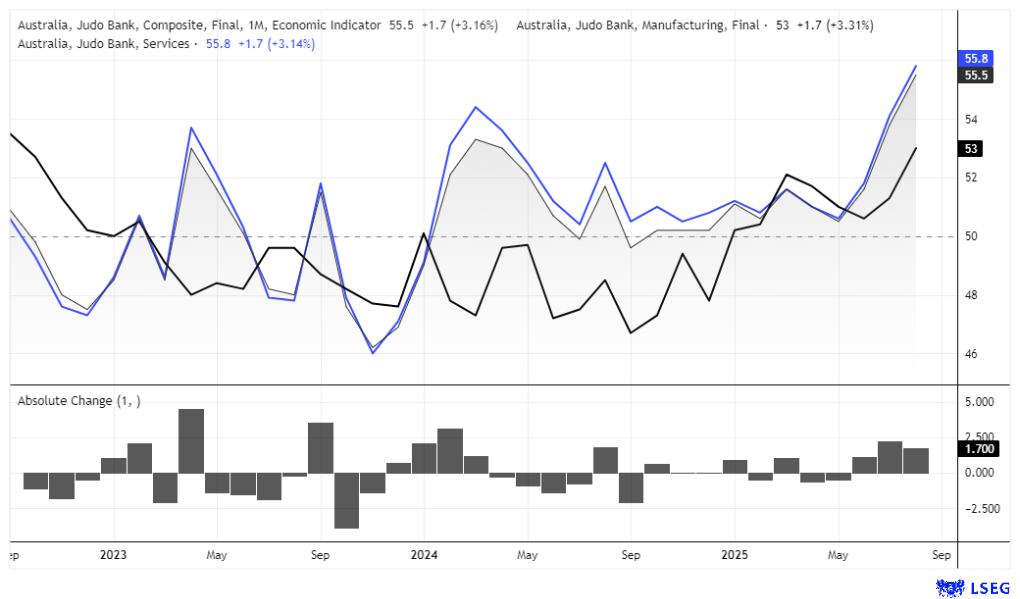
Chart analysis by Matt Simpson - data source: S&P Global, LSEG
Australian Inflation in Focus as RBA Rate Cut Bets Shift
Wednesday’s inflation report will be closely watched to determine whether July’s sharp CPI rise was mainly due to the expiry of electricity subsidies, or if price pressures were more broadly spread. Trimmed mean CPI rose 0.6 percentage points in July, though this measure excludes the top 15% of volatile items, suggesting the reflation may have been subsidy-driven.
If inflation remains elevated or accelerates further, expectations for RBA rate cuts could be pushed well into next year. To gain confidence that July’s spike was temporary, traders would likely want to see annual trimmed mean inflation fall by at least 0.6 percentage points.
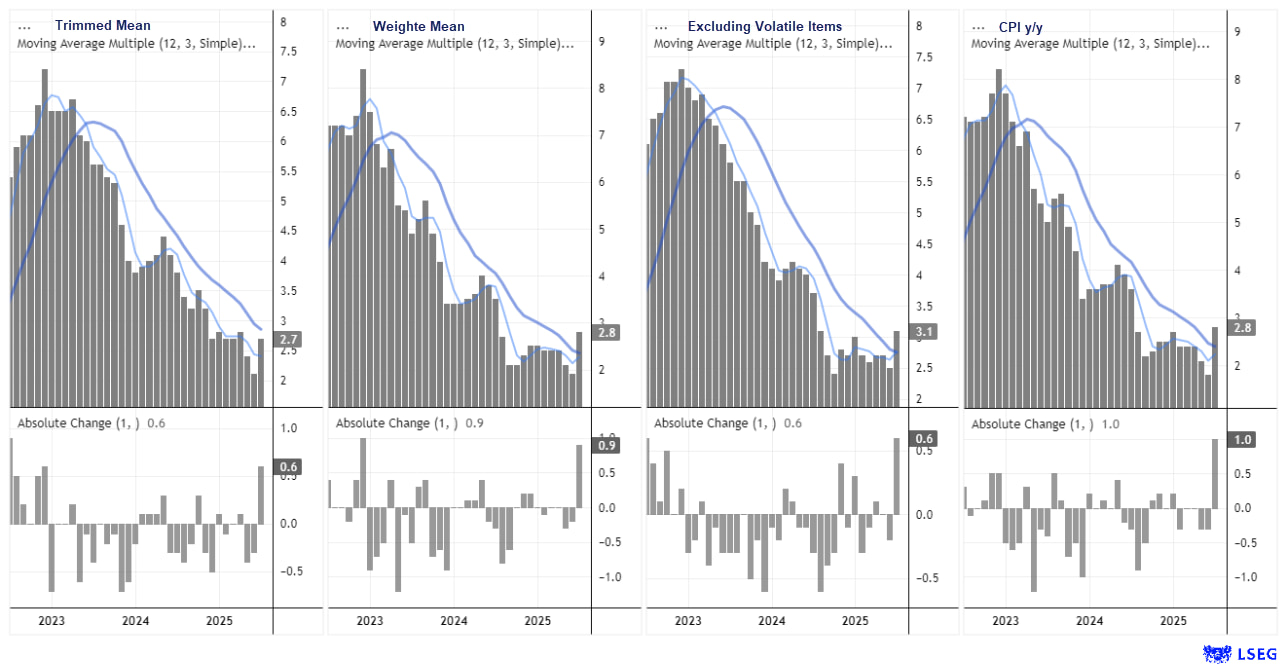
Chart prepared by Matt Simpson - data source: ABS, LSEG
AUD/USD Holds Strong Ties to China, NZD and Inverse USD Relationship
The relationship between the Australian dollar and China is realigning, with the 20-day correlation between AUD/USD and both copper and the CSI 300 index now back above 0.8. The correlation with the New Zealand dollar also remains strong, as does the inverted relationship with the US dollar.
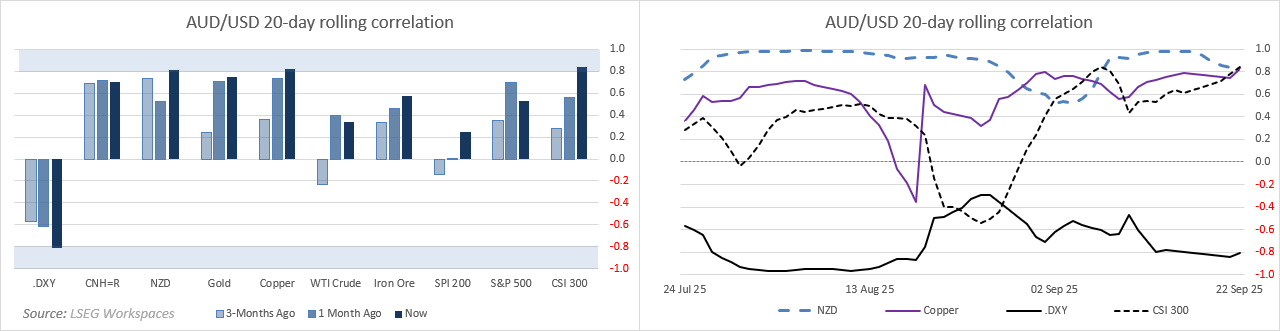
Chart prepared by Matt Simpson - data source: LSEG

Australian Dollar Implied Volatility Drops, Bearish Bets Rise
Expectations of future volatility in AUD/USD continue to trend lower, with 1-month implied volatility falling to a 14-month low last week. While overnight implied volatility spiked around the FOMC meeting, it too dropped back to a 2-month low by Friday’s close, sitting well below the 1-week measure. With US PCE inflation now the key data point rather than employment, volatility is likely to remain subdued unless Australia’s CPI delivers a surprise or another fresh catalyst emerges.
Risk reversals have eased from their recent cycle highs alongside AUD/USD after the FOMC meeting, reflecting a rise in puts (bearish bets) relative to calls (bullish bets). Whether this is simply a retracement within the broader bullish trend or the start of a reversal is unclear, though at this stage the pullback looks limited.

Chart prepared by Matt Simpson - data source: LSEG
AUD/USD Pulls Back as DXY Rebound Tests Key Resistance
The sharp rebound in the US dollar cannot be ignored. Its post-FOMC three-day rally marked the strongest run in six weeks and confirmed a double bottom at the 2023 low, reinforcing that level as strong support. However, upside potential may be capped if the labour market continues to soften, supporting expectations for Fed cuts. For now, much of the move looks like short-covering from traders positioned for a 50bp cut that never materialised.
For AUD/USD, the reversal around 0.6680 was unsurprising given the confluence of the November high and the 200-week moving averages. The question now is how deep a retracement we’ll see. Bears are likely eyeing the 0.6543 high-volume node (HVN) as an initial target, though a particularly weak inflation print may be needed to drive the Aussie below 0.65. On the DXY side, resistance sits at 98.33, and until that breaks, the broader rebound is likely to remain limited.
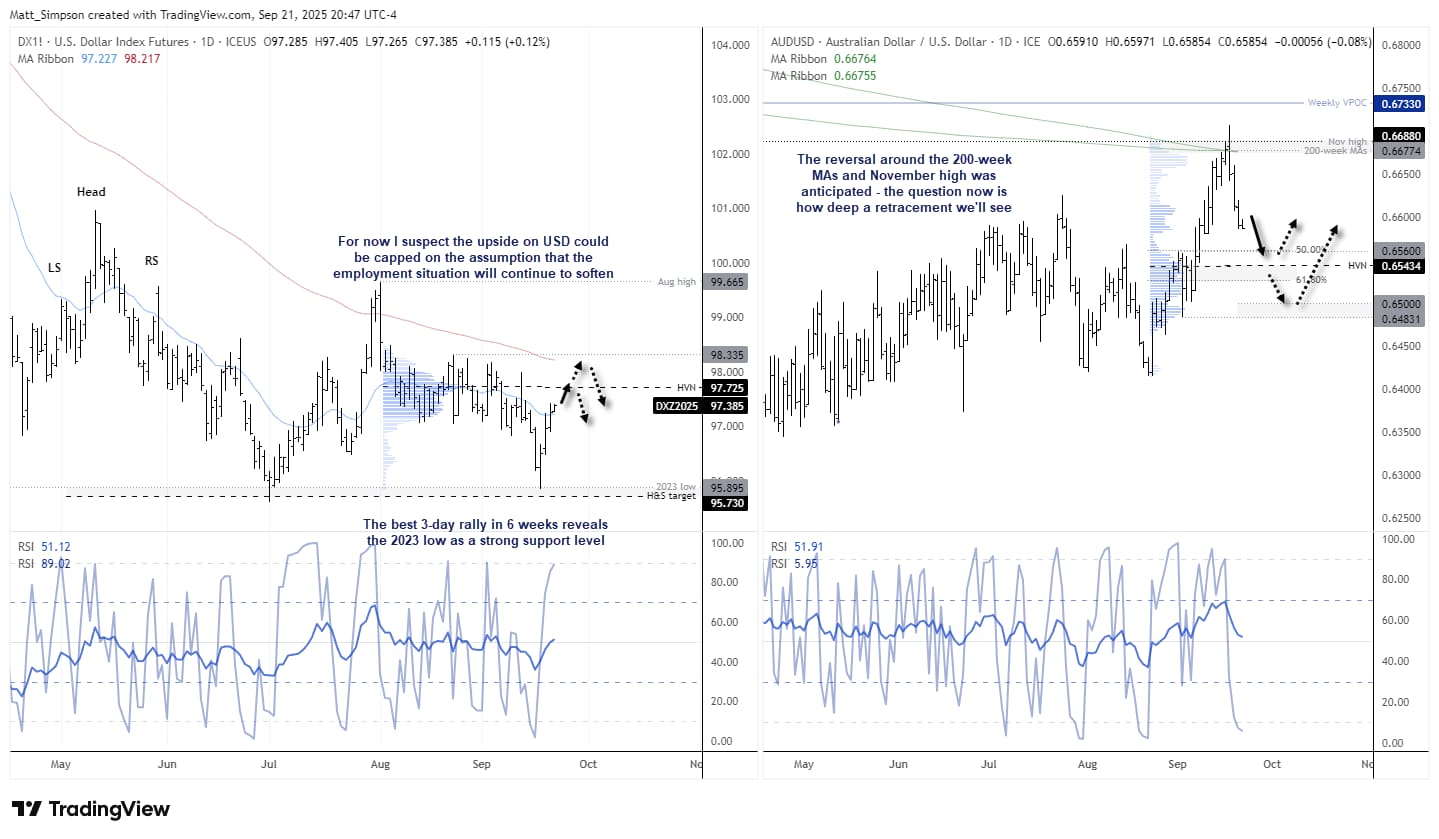
Chart analysis by Matt Simpson - data source: TradingView AUD/USD
View the full economic calendar
-- Written by Matt Simpson
Follow Matt on Twitter @cLeverEdge
How to trade with City Index
You can trade with City Index by following these four easy steps:
- Open an account, or log in if you’re already a customer
• Open an account in the UK
• Open an account in Australia
• Open an account in Singapore
- Search for the market you want to trade in our award-winning platform
- Choose your position and size, and your stop and limit levels
- Place the trade


