


The Australian dollar continues to grind higher, with AUD/USD holding firmly above the 70c handle after a strong bullish engulfing signal at the 20-day EMA. The broader trend remains constructive, but this week’s inflation data and RBA commentary will determine whether momentum extends towards the 2023 high at 0.7157 — or whether choppy trade returns as correlations fade and positioning stretches.
View related analysis:
- AUD/JPY Outlook: Reversal Clues Threaten the Mighty Aussie Yen Trend
- ASX 200 Market Outlook: Record Highs Set, SPI Futures to Follow?
- Australian Jobs Strong Enough to Keep RBA Alert, But Not Force Action
- Australian Dollar Outlook: AUD/USD Rally Vulnerable to Chop at the Top
Australian Dollar Performance
The Aussie rose against all major currency pairs, though momentum slowed against the US dollar and it was slightly lower against the Chinese yuan
- AUD/USD rose for a fifth week, its best such since July 2024
- AUD/JPY is on track for a sixth month higher, though it around the 1991 high on Friday – a potential pivotal level this week
- AUD/NZD rose to a 13-year high after the RBNZ held rates and were not hawkish as expected
- AUD/CAD rose for a ninth week, its best such run since 2010
- GBP/AUD fell for a seventh week, its worst such run since April 2022
- EUR/AUD was also down for a ninth week and now sits at a 1-year low
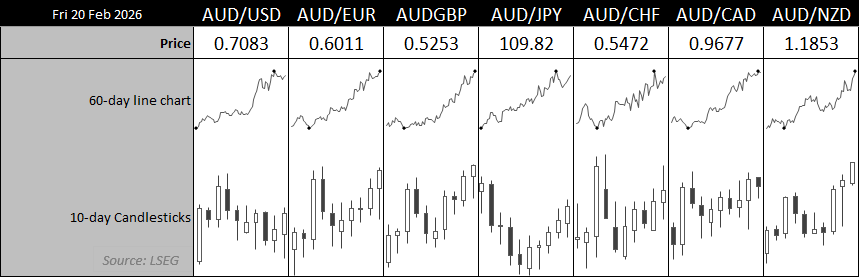
Chart prepared by Matt Simpson - Source: LSEG
Australia This Week: Economic Data and Events for AUD/USD Traders
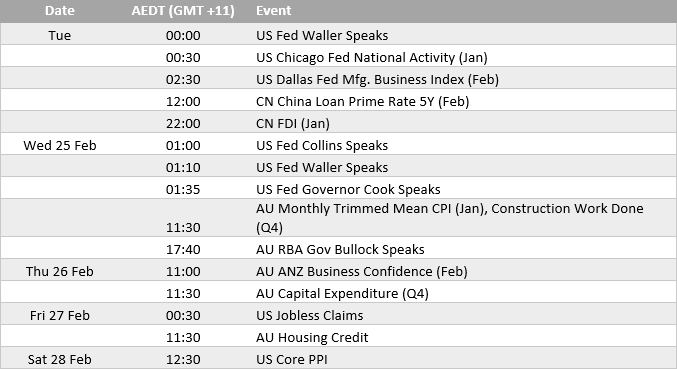
RBA policy outlook: CPI unlikely to force the RBA’s hand (yet)
We could cling to the fact that the RBA pays closer attention to trimmed mean than headline CPI, but it is harder to ignore the headline inflation figure when it is trending higher at 3.8% y/y. Moreover, trimmed mean is also moving in the wrong direction, having risen to 3.3% y/y in December.
That said, I don’t really see Wednesday’s inflation report moving the dial much for RBA policy expectations. The central bank quite rightly has its finger hovering over the hike button, but it is too soon to expect another 25bp increase unless we see unusually hot numbers in this week’s CPI report. Last week’s employment figures were mixed, albeit skewed to the upside, and simply keep the RBA alert but not ready to act, in my view.
Governor Bullock speaks at the Melbourne University Faculty of Economics & Business Foundation Dinner on Wednesday. I’m not expecting any drastic policy clues to be dropped, but it is worth keeping on the radar — particularly as it comes just hours after the inflation report.

Tariffs Resurface as a Market Wildcard
Donald Trump is set to deliver his State of the Union Address — likely more political theatre than policy shock. However, tariffs are creeping back into the narrative.
The Supreme Court’s attempt to annul earlier measures has forced a pivot toward a new 10% global tariff, and early pushback from the EU suggests trade tensions could re-intensify.
For traders, this keeps headline risk elevated. Any escalation risks denting appetite for risk-sensitive assets, with AUD/USD particularly exposed as a high-beta proxy for global growth sentiment.

AUD/USD Technical Analysis: Australian Dollar vs US Dollar
AUD/USD Futures Positioning | COT Report
- Asset managers flipped to net-long exposure to AUD/USD futures fort the first time since October 2024 last week
- It was mostly a function of short covering over long initiation, and net-long exposure is only marginal at 1761 contracts
- Large speculators were net-long for a fourth week, and at their most bullish level in 9 years of 15.9k contracts
- Again, this was mostly a function of snort covering over new bullish bets, which further suggests the current bullish rally could be losing steam
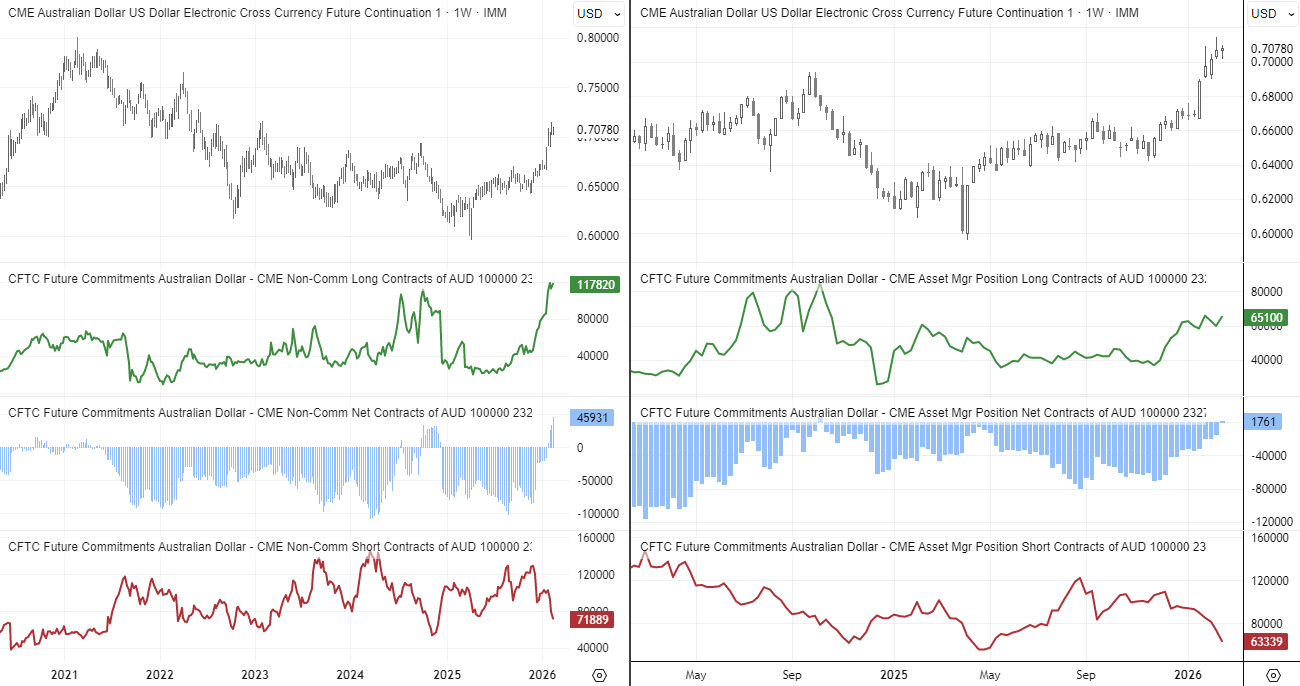
Source: CFTC, CME, LSEG
AUD/USD Correlations
- The fact that we’re seeing classic correlations with the Australian dollar diminish backs up my hunch that we’re in for choppy trading conditions for AUD/USD.
- Notice how the 10-day correlations are converging towards zero — signalling no clear relationship — which is often a leading indicator for the 20-day correlation.
- I’m not entirely convinced we’ll see a return of the classic correlations this week, unless a clear directional cue emerges from risk appetite (in either direction).
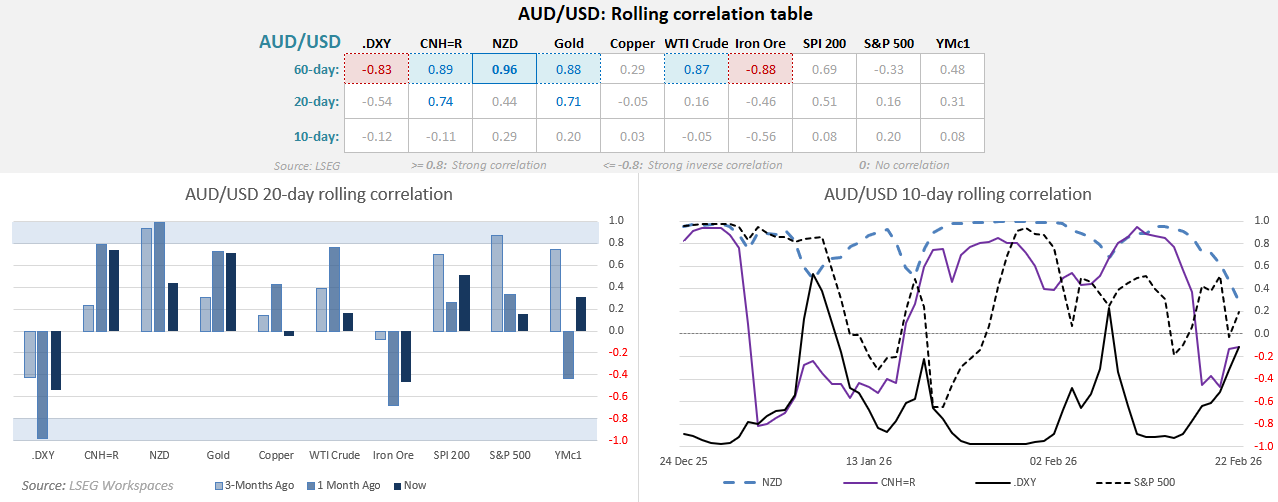
Chart prepared by Matt Simpson - Source: LSEG
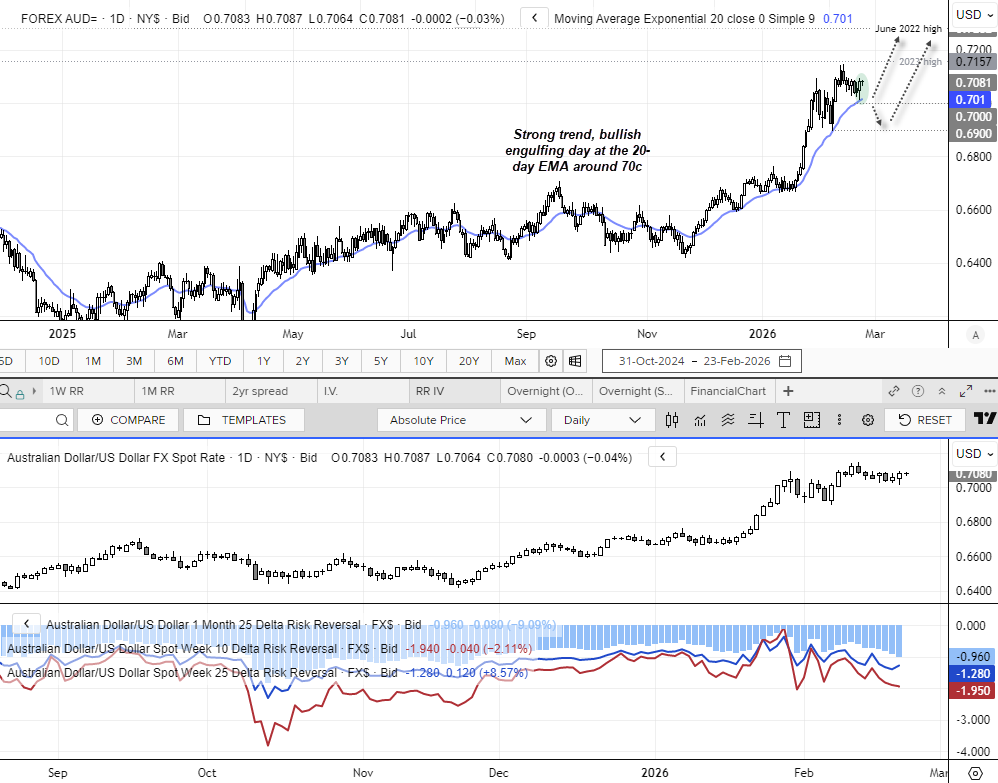
AUD/USD Technical Analysis: Bulls Defend 0.70 as Upside Targets Come Into View
Let’s not overcomplicate a good trend. AUD/USD is clearly pointing higher overall, and after a week of choppy trade it is hinting at a swing low. Friday’s bullish engulfing candle formed around the 20-day EMA and the 70c handle. Bulls could seek dips within Friday’s range and maintain a near-term bullish bias while prices hold above Friday’s low, with a move towards the 2023 high (0.7157) in sight. A break above that level would bring the June 2022 high (0.7282) into focus.
A decisive break below 70c brings the 69c handle into focus. For now, however, the trend suggests dip buyers remain the dominant force. Also note that risk reversals are attempting to curl higher, which supports the view that pullbacks could remain limited.
Source: ICE, TradingView
View the full economic calendar
-- Written by Matt Simpson
Follow Matt on Twitter @cLeverEdge
How to trade with City Index
You can trade with City Index by following these four easy steps:
- Open an account, or log in if you’re already a customer
• Open an account in the UK
• Open an account in Australia
• Open an account in Singapore
- Search for the market you want to trade in our award-winning platform
- Choose your position and size, and your stop and limit levels
- Place the trade


