


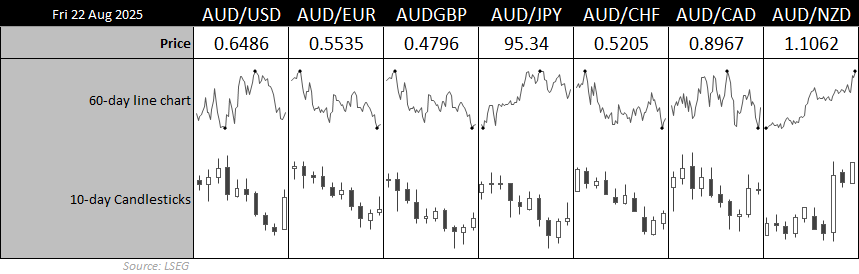
The Australian dollar is drawing interest from dip buyers after finding support near key technical levels. Last week’s rally came on the back of Jerome Powell’s dovish Jackson Hole speech, which fuelled renewed bets on Fed cuts and weakened the US dollar. Still, with the RBA reluctant to ease further immediately and US PCE inflation in focus this week, upside for AUD/USD could remain limited.
View related analysis:
- US Dollar Mixed Amid Anti-Fed Headlines, Flash PMIs, Jackson Hole
- AUD/USD, ASX 200 Outlook: Australia’s Consumers Rejoice Latest RBA Cut
- AUD/JPY Dips to Support, Australian Full-Time Jobs Bounce
Powell’s Dovish Fed Boosts the Australian Dollar
The Australian dollar closed last week with its best daily performance in three months, fuelled by US dollar weakness following Jerome Powell’s Jackson Hole speech. Powell acknowledged labour market weakness, noting a “curious balance” between slowing supply and demand—raising risks of higher unemployment and fewer layoffs.
His comments effectively green-lighted a September cut while leaving room for another in December if employment conditions deteriorate. Fed funds futures now imply an 83% chance of a September cut, though odds for December remain lower at 49.2%.
RBA Likely to Remain Cautious Following Strong Jobs Data
Australia’s recent data is unlikely to push the Reserve Bank of Australia (RBA) into immediate action. Unemployment dipped to 4.2%, and the 60.5k surge in full-time jobs offset last month’s -38.2k fall. Consumer sentiment also rose strongly in response to the RBA’s earlier 25bp cut, lowering the odds of another near-term move.
The RBA minutes are unlikely to shift the outlook, with forecasts still allowing for only one more cut this year and another 25bp in each half of 2026.

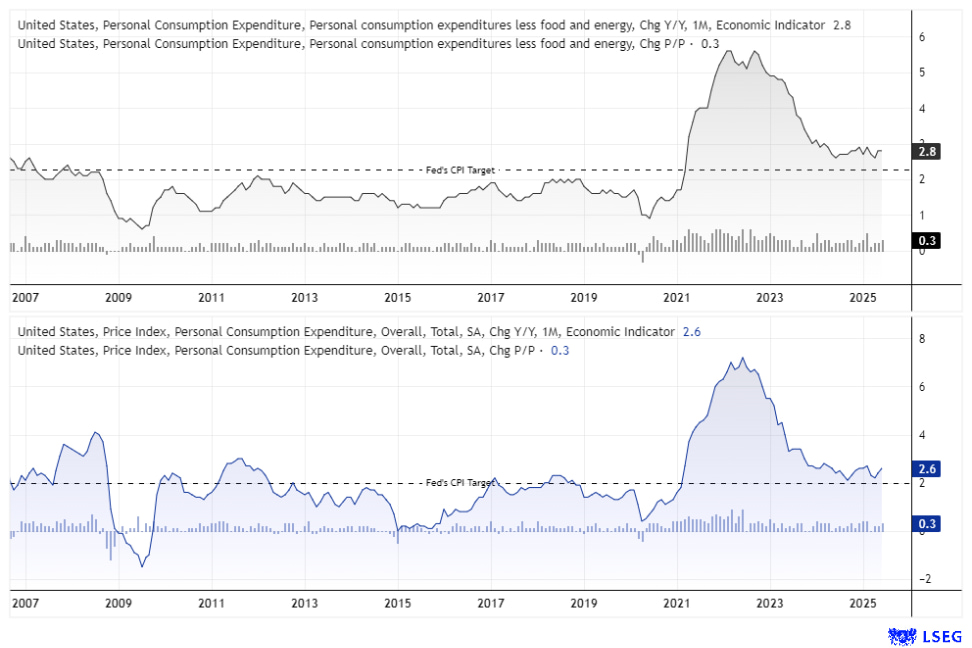
US PCE Inflation in Focus for AUD/USD
Markets now turn to US PCE inflation — the Fed’s preferred gauge. Core CPI already climbed to 3.1% y/y, and if core PCE edges closer to 3%, it could erode odds of a December cut. This would risk a US dollar rebound and cap further AUD/USD gains.
AUD/NZD and Cross-Currency Correlations
The RBNZ delivered a dovish 25bp cut last week, sparking a 0.9% rally in AUD/NZD to a near four-month high. This move has seen the previously near-perfect 10-day correlation between AUD/NZD and NZD/USD ease to 0.78. However, given the US dollar’s dominance post-Jackson Hole, correlations across AUD/USD, AUD/NZD and NZD/USD are likely to remain strong.
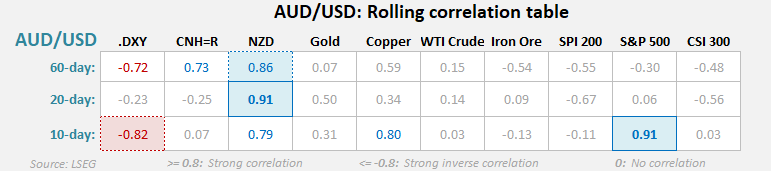
Chart analysis by Matt Simpson - data source: CME, LSEG
AUD/USD Futures Positioning (COT Report)
Net-short exposure on AUD/USD futures climbed again last week, with asset managers and large speculators reaching fresh 14- and 16-month highs. Rising open interest confirms momentum behind the bearish positioning.
However, renewed Fed cut expectations and US dollar weakness may drive short-covering, offering near-term support for the Australian dollar.

Chart analysis by Matt Simpson - data source: CME, LSEG
AUD/USD Technical Outlook
On the weekly chart, AUD/USD remains rangebound between 0.64 and 0.66. While the lower wicks around 0.6420 suggest dips could be bought, bulls may hesitate unless the Fed signals multiple cuts.
The 50-week EMA at 0.6472 and 200-day EMA at 0.6455 provide key support levels for potential swing lows. Still, with Friday’s rally stalling at the 50-day EMA, a near-term pullback cannot be ruled out.

Chart analysis by Matt Simpson - data source: TradingView AUD/USD
View the full economic calendar
-- Written by Matt Simpson
Follow Matt on Twitter @cLeverEdge
How to trade with City Index
You can trade with City Index by following these four easy steps:
- Open an account, or log in if you’re already a customer
• Open an account in the UK
• Open an account in Australia
• Open an account in Singapore
- Search for the market you want to trade in our award-winning platform
- Choose your position and size, and your stop and limit levels
- Place the trade


