
The Australian dollar faces a pivotal week, with geopolitical tensions in the Middle East and key US economic data combining to drive volatility across FX markets.
While domestic data remains relevant, its impact may be overshadowed by broader macro forces, particularly as rising oil prices and safe-haven demand support the US dollar. With ISM reports and nonfarm payrolls (NFP) on deck, traders are likely to focus on how inflation and growth dynamics evolve against an increasingly uncertain geopolitical backdrop.
For AUD/USD, the balance of risks appears tilted to the downside, as elevated volatility and shifting sentiment leave the pair vulnerable to further losses.
View related analysis:
- AUD/USD Outlook 2026: Key Drivers for the Australian Dollar in Q2
- AUD/USD, EUR/AUD Outlook: RBA Hikes Again as Inflation Pressures Build
- US Dollar Outlook: Bulls Resurface, Breakout on the Cards?
- Australian Dollar Outlook: Strait of Hormuz Risk Clouds AUD/USD Rally
AUD/USD Outlook: Geopolitics and US Data Set the Tone for Volatility
Middle East Tensions Escalate, Broadening Regional Risk
The conflict involving Iran shows little sign of de-escalating. If anything, tensions are broadening across the region, with Iran-aligned militias in Iraq launching attacks on US-linked assets and Houthi forces in Yemen continuing to disrupt shipping routes in the Red Sea.
US Military Build-Up Signals Prolonged Geopolitical Risk
The United States has responded by deploying an additional 3,500 troops to the region, with further reinforcements reportedly under consideration. This would add to an existing US presence of around 50,000 personnel across the Middle East. While a full-scale ground invasion has not materialised, the steady build-up of forces points to a prolonged period of heightened geopolitical risk.
At the same time, regional and international efforts to contain the conflict are ongoing. Officials from Egypt, Saudi Arabia and Turkey have held talks aimed at de-escalation, with Pakistan emerging as a potential host for further negotiations.
For markets, the key takeaway is that geopolitical developments are likely to overshadow domestic data in the near term. Elevated tensions risk supporting oil prices and underpinning safe-haven demand for the US dollar — a combination that could limit upside for AUD/USD despite Australia’s relatively firm economic backdrop.

Middle East Risks for Traders (AUD/USD, Oil, USD Outlook)
- Red Sea disruption escalates – Houthi activity threatens key shipping routes, raising freight costs and adding upside risk to oil prices
- Oil price shock – Higher energy prices could reignite inflation pressures and complicate the outlook for central banks
- Central bank constraint – Sticky inflation may limit the scope for rate cuts, particularly for the Fed, supporting higher yields
- Risk sentiment deterioration – Escalating geopolitical tensions could trigger risk-off flows across global markets
- US dollar strength – Safe-haven demand may underpin the USD during periods of uncertainty
- AUD/USD downside pressure – A stronger USD and higher oil prices could weigh on the Australian dollar, limiting upside or prompting a pullback
Australia This Week: Economic Data and Events for AUD/USD Traders
The main issue traders face with much of the economic data is that it does not yet fully reflect the impact of the war involving Iran. While it would be easy to dismiss incoming data as outdated, weaker figures could carry more weight in the current environment. If employment or growth metrics were already softening while inflation pressures were building prior to the conflict, there is a reasonable chance those dynamics will worsen.
RBA minutes
We know the decision to hike was finely balanced, with a 5–4 split in favour, and that the Bank may have delivered a more hawkish move were it not for the conflict in the Middle East. However, Assistant Governor Kent has since suggested the RBA could still be forced to hike, even in the face of weaker growth, to ensure inflation expectations remain anchored. In that sense, the minutes may already have been superseded by more recent commentary.
PMIs, ISM
As the S&P global PMIS are final reports – and unlikely to be heavily revised - attention turns to the ISM reports for the US. Manufacturing prices have already jumped to a 3.5-year high of 70.5, and seem likely to at least remain elevated. Should it move higher still, then it stokes fear of inflation and likely supports the US dollar via higher yields and improved odds of Fed hikes.
Nonfarm payrolls (NFP)
This will be a closely watched release following February’s -92k headline print. With a 12-month average of just 13k jobs and four of the past nine releases printing negative, a weak report alongside elevated ISM price pressures would reinforce stagflation concerns. Paradoxically, that could still support the US dollar if markets price in the risk of the Fed being forced to hike into a downturn, while weighing on AUD/USD as it takes direction from broader risk sentiment.

Australian Dollar Performance
Momentum has finally turned against the otherwise resilient Australian dollar. It has enjoyed a strong start to the year and held near its highs despite an influx of geopolitical headlines. But a correction now appears to be underway.
- AUD/USD closed firmly below 0.70, marking its worst week in a year
- AUD/CAD formed a bearish outside week and closed beneath its 2023 high
- AUD/CHF printed a three-week bearish reversal (evening star formation)
- AUD/EUR closed lower for a second week and suffered its worst week in a year after snapping a record 12-week rally
- AUD/GBP fell to a five-week low, marking its worst week in 12 months
- AUD/JPY has pulled back towards 110, with bears now eyeing a break below the 2024 high (109.37)
- AUD/NZD is back below 1.12 after a second week lower, although it remains in a strong uptrend overall
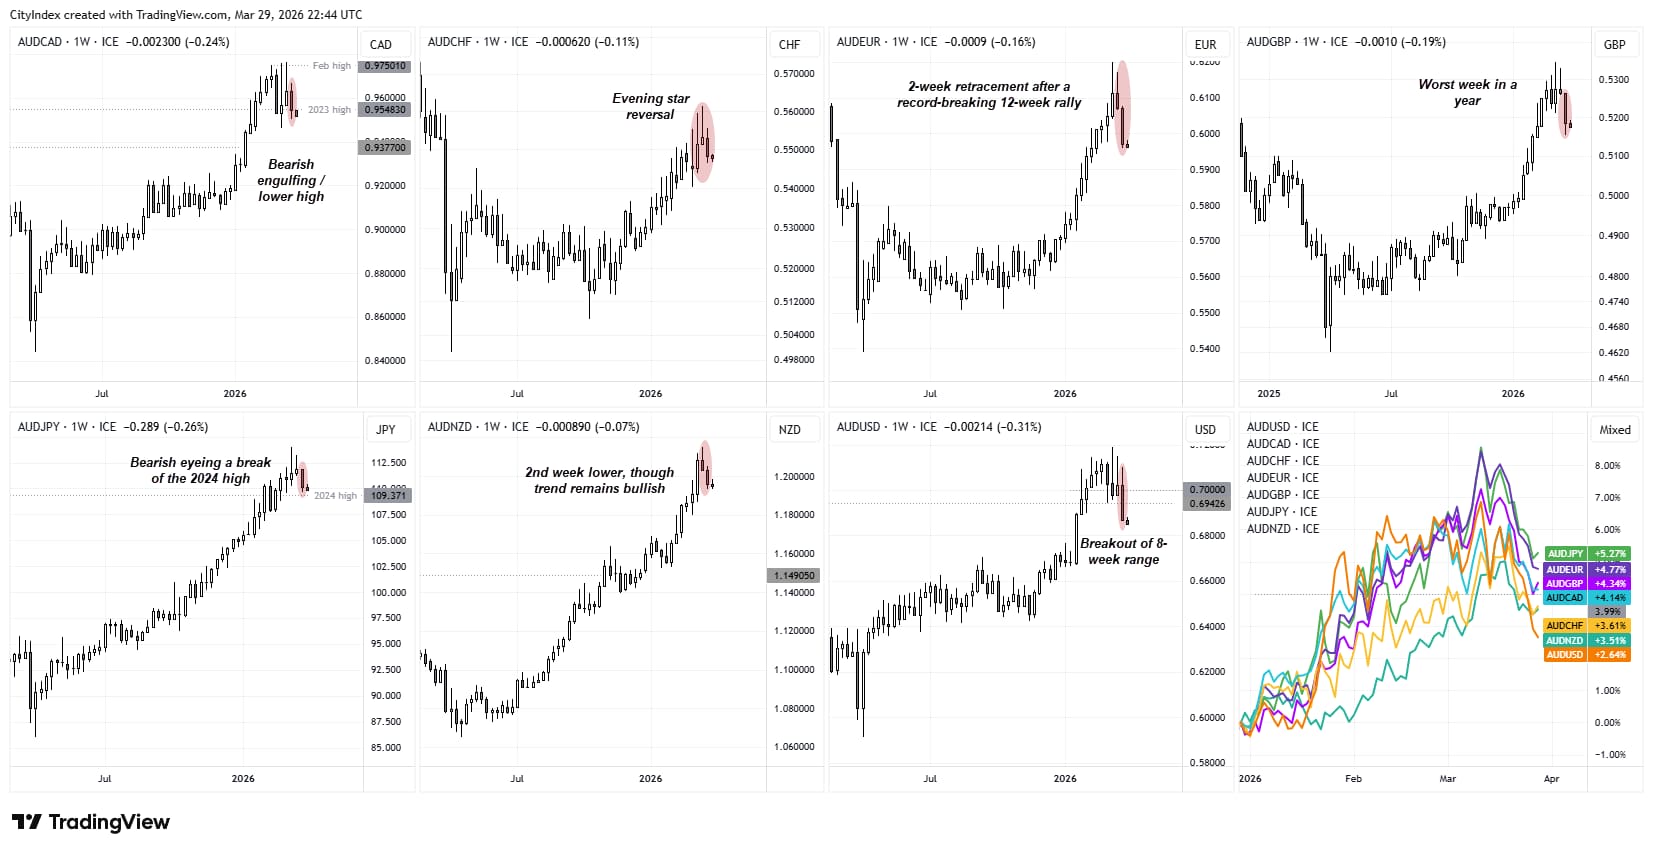
Source: TradingView
AUD/USD Technical Analysis: Australian Dollar vs US Dollar
AUD/USD Correlations
Correlation metrics for the Australian dollar appear slightly lagged, given AUD/USD has already broken lower from its eight-week range. This is now being reflected in a strengthening inverse relationship with the US dollar index, with the 10-day correlation at -0.84 and the 20- and 60-day measures likely to follow if downside momentum persists.
The breakdown in AUD/USD appears to be leading correlation shifts rather than reacting to them.
AUD/USD continues to show strong positive correlations with the Chinese yuan and New Zealand dollar, which remain among its most reliable directional drivers. These relationships are likely to hold in the near term, particularly if China-linked sentiment and broader risk trends remain the dominant macro themes.
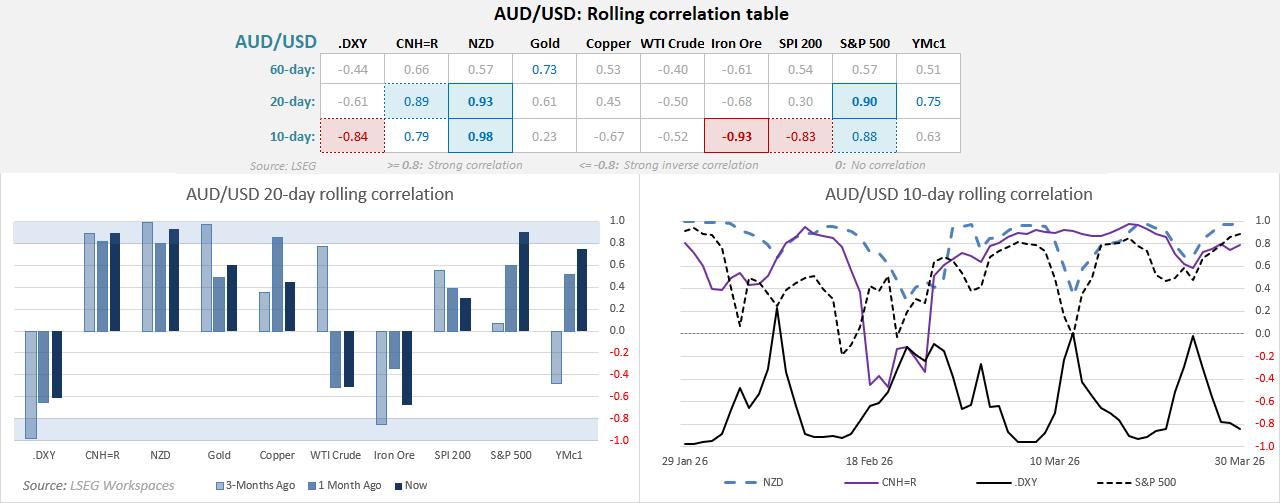
Source: LSEG
AUD/USD Futures Positioning | COT Report
Momentum is finally turning lower after an eight-week consolidation near its 2023 high. This sees AUD/USD slip back below 0.70 and highlights the potential for further downside.
Bullish sentiment had become stretched in recent weeks, with asset managers’ net and gross longs reaching a record high the week prior, while large speculators’ bullish exposure hovered around nine-year highs. In both cases, however, we have since seen a modest reduction in bullish positioning from these extremes.
Notably, there has yet to be a meaningful pickup in short positions against the Australian dollar. With the RBA still signalling the potential for further hikes, any pullback is more likely to be driven by long liquidation rather than a build-up of fresh short exposure.
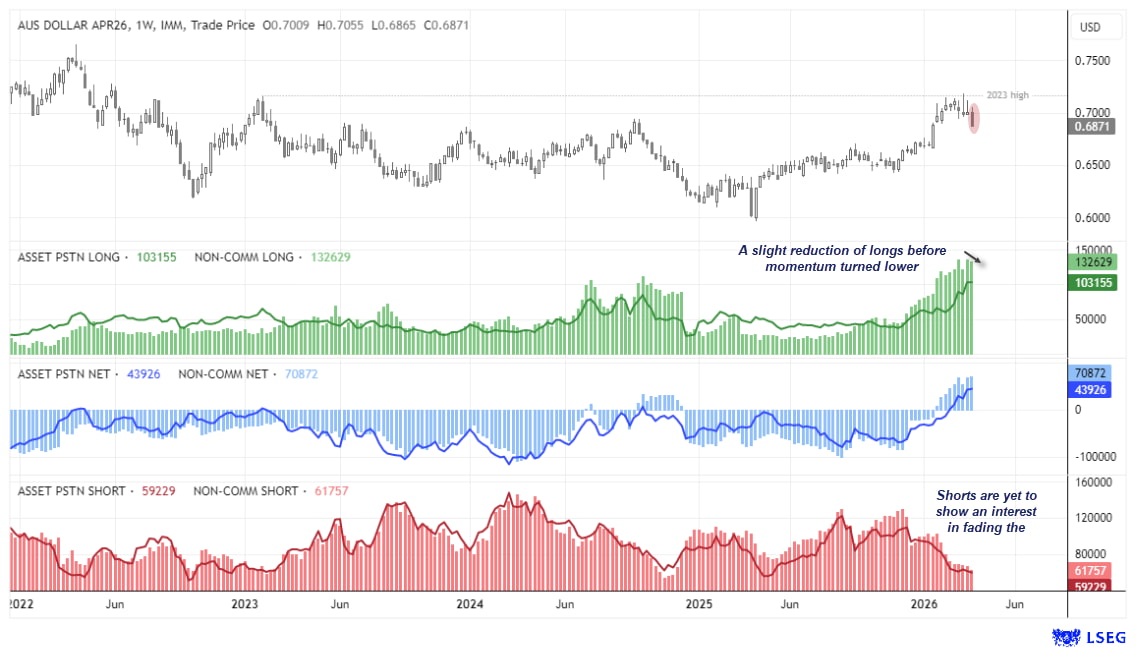
Source: CFTC (COT) CME, LSEG
AUD/USD Options and Volatility Analysis (Risk Reversals, HVN Levels)
Prices are beginning to catch up with the bearish skew options traders have been warning about for several weeks. Interestingly, however, risk reversals remain above their recent lows, indicating that demand for puts is not increasing relative to calls. This suggests the move lower is more a case of spot prices closing the gap, rather than traders actively chasing downside via options markets.
This aligns with COT data, which shows that any pullback is more likely being driven by long liquidation rather than a build-up of fresh bearish positions.
With implied volatility remaining elevated and momentum pointing firmly lower on AUD/USD, a move towards the 0.6770 high or the high-volume node (HVN) around 0.6693 could be on the cards. Bears may look to fade rallies towards 0.70, although a retracement of that magnitude appears unlikely at this stage.
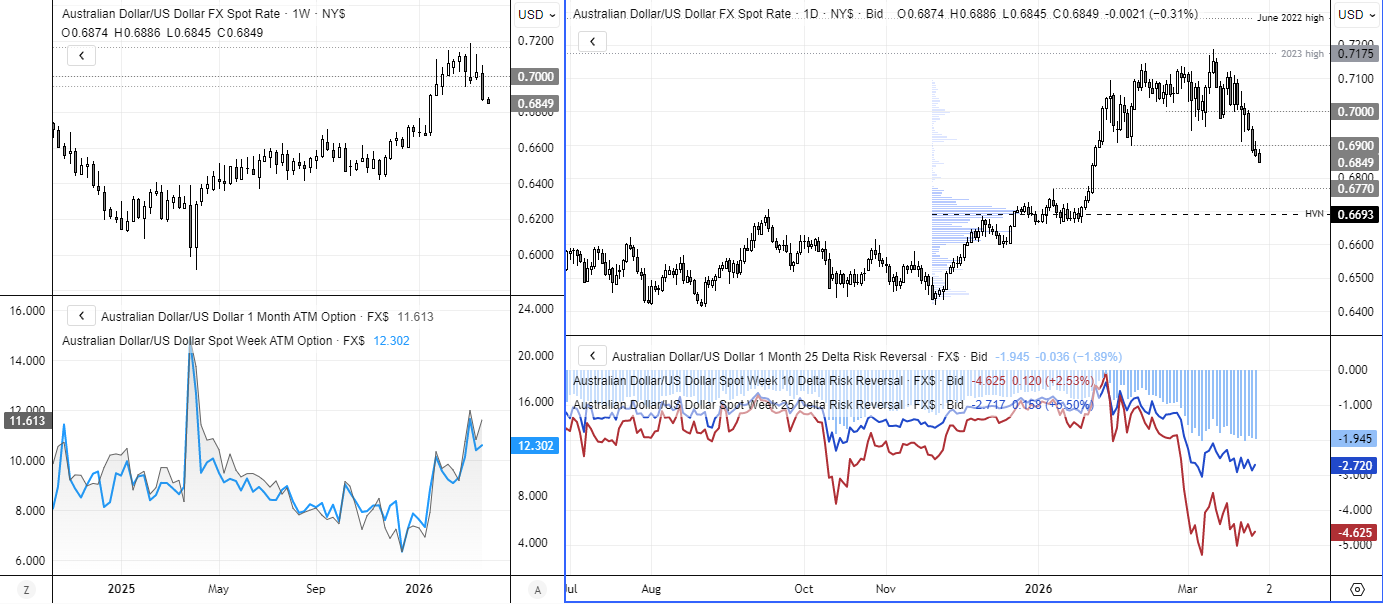
Source: ICE, TradingView
View the full economic calendar
-- Written by Matt Simpson
Follow Matt on Twitter @cLeverEdge
How to trade with City Index
You can trade with City Index by following these four easy steps:
- Open an account, or log in if you’re already a customer
• Open an account in the UK
• Open an account in Australia
• Open an account in Singapore
- Search for the market you want to trade in our award-winning platform
- Choose your position and size, and your stop and limit levels
- Place the trade