


Australian Dollar Outlook: AUD Momentum, Seasonality and Key Market Drivers
Australian Dollar Performance
A closer look at the Australian dollar’s performance against its FX peers suggests the post-RBA hawkish enthusiasm may be stalling. While a fresh catalyst may be needed to extend gains, December seasonality could still provide a modest tailwind into year-end.
- AUD/USD rose for a third consecutive week on diverging RBA–Fed policy expectations, though bullish momentum is starting to fade
- AUD/JPY reached a 3.5-year high but remains hesitant above the 104 level
- AUD/NZD continues to consolidate below 1.15 following a sharp multi-week advance
- AUD/CHF snapped a three-week winning streak
- The Australian dollar also weakened against the euro and British pound
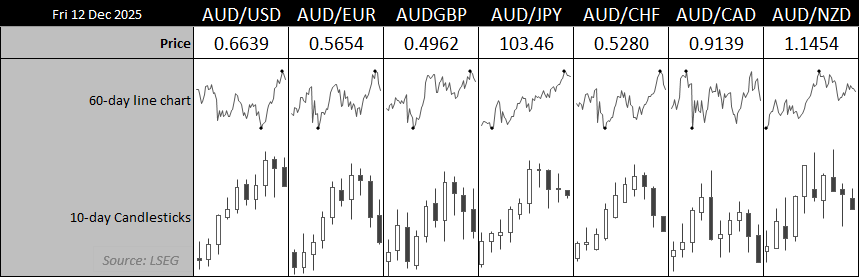
Chart prepared by Matt Simpson - Source: LSEG
Australia This Week: Economic Data and Events for AUD/USD Traders
|
Date |
AEDT (GMT +11) |
Event |
|
Mon 15 Dec |
08:30 |
NZ Performance of Services Index (Nov) |
|
|
12:30 |
CN House Prices (YoY) (Nov) |
|
|
13:00 |
CN Unemployment Rate, Industrial Production, Fixed Asset Investment, Retail Sales YTD (Nov), NBS Press Conference |
|
Tue 16 Dec |
08:45 |
NZ Food Price Index (Nov) |
|
|
09:00 |
AU Judo Bank Flash PMIs (Dec) |
|
|
09:15 |
AU RBA Assistant Governor Jones Speaks |
|
|
10:30 |
AU Westpac Consumer Sentiment (Dec) |
|
|
11:00 |
NZ Budget Balance, Economic Forecast (Jul) |
|
Wed 17 Dec |
00:15 |
US ADP Employment Change Weekly |
|
|
00:30 |
US Nonfarm Payrolls, Unemployment, Earnings, Retail Sales, Building Permits, Import Prices (Nov) |
|
|
01:45 |
US S&P Global Flash PMIs (Dec) |
|
Thu 18 Dec |
00:15 |
US Fed Waller Speaks |
|
|
01:05 |
US FOMC Member Williams Speaks |
|
04:30 |
US FOMC Member Bostic Speaks |
|
|
08:45 |
NZ GDP (QoQ) (Q3) |
|
|
11:00 |
AU MI Inflation Expectations |
|
|
Fri 19 Dec |
00:30 |
US CP (Nov), Philadelphia Fed Manufacturing Index (Dec), Initial Claims |
|
Sat 20Dec |
00:30 |
US Core PCE Price Index (Oct) |

Fed Cut Leaves USD Direction Data-Dependent
The Fed delivered a 25bp cut as expected, though divisions within the committee over future easing are evident. Three FOMC members dissented: one favoured a larger cut, while two preferred no cut at all. Incoming data will therefore play a key role in shaping near-term expectations for further cuts in H1, with direct implications for the US dollar — and by extension the Australian dollar.
US data continues to be backfilled, with this week’s calendar split into two clear clusters. NFP, retail sales and flash PMIs are released on Wednesday, followed by two key inflation reports — CPI and PCE — late on Friday.
- S&P Global PMIs remain elevated, signalling solid economic growth, although the pace of expansion slowed in November
- Services inflation cooled at its fastest pace in 21 months, according to the latest ISM report
- Doves will be watching whether NFP mirrors the recent softness seen in ADP payrolls
RBA Speech Unlikely to Shift Policy Focus From Data
While RBA Assistant Governor Kent speaks on Tuesday, the address is unlikely to include any commentary on monetary policy. That said, further guidance may not be necessary. The RBA has made it clear that incoming data between now and February — particularly the quarterly CPI release in late January — will be critical. With February flagged as a potentially live meeting, AUD/USD traders should pay close attention to this week’s flash PMI reports for early signals on inflation, growth and employment.
AUD/USD December Seasonality: Average Returns and Win Rates
Over the past 20 years, AUD/USD has posted an average December return of 0.79%, although the median return is close to flat at 0.08%. The 56% win rate gives bulls only a modest statistical edge overall.
A closer look at average daily returns within December shows the bullish bias tends to emerge from around 20 December onwards. From that point, most sessions deliver positive average returns, with win rates consistently above 50%. Both returns and win rates typically strengthen further from Christmas Eve through to New Year’s Eve, aligning with well-known year-end seasonality patterns.
By contrast, the current week has historically produced negative average returns, even though the win rate during this period remains mixed rather than decisively bearish.
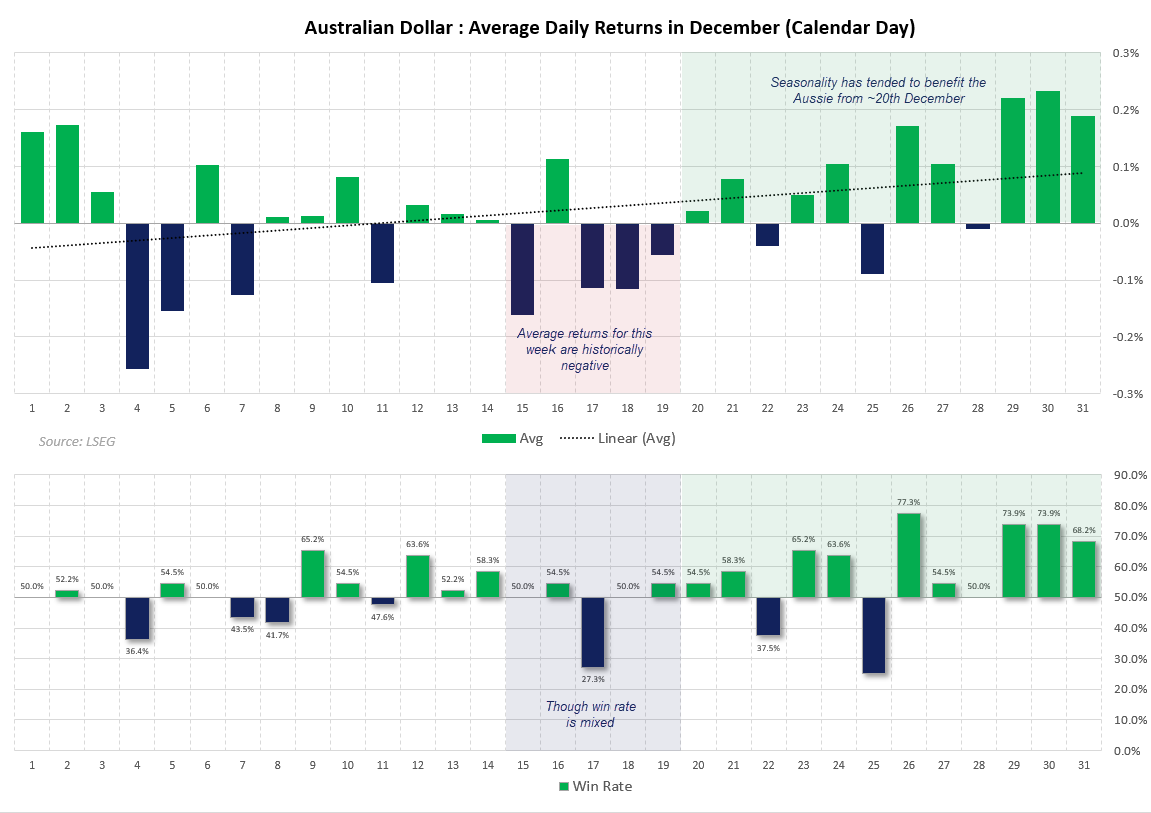
Chart prepared by Matt Simpson - Source: ABS, LSEG
AUD/USD Correlations
- The 20-day inverse correlation between the Australian dollar and the US dollar (DXY) remains strong at -0.86, although it has weakened over the near term, with the 10-day correlation easing to -0.53. This suggests the USD relationship is becoming less reliable for short-term signals.
- A similar pattern is evident with risk assets — using the S&P 500 as a proxy — and, to a lesser extent, the Chinese yuan, where correlations have moderated at shorter lookbacks.
- By contrast, the historical link with copper has broken down, with the 10-day correlation slipping to -0.20, indicating little to no relationship in the near term.
- The standout remains NZD/USD, which continues to show a strong positive correlation with AUD/USD across the 10-, 20- and 60-day periods, reinforcing the tight relationship between the two antipodean currencies.
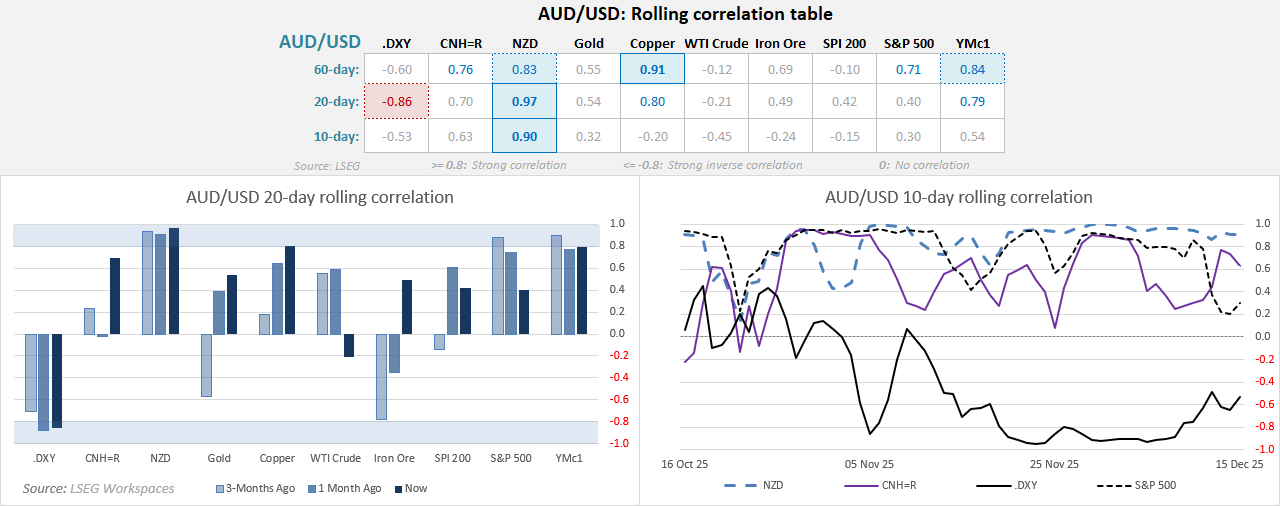
Chart prepared by Matt Simpson - Source: LSEG

AUD/USD Technical Analysis: Australian Dollar vs US Dollar
AUD/USD Loses Momentum as Price Stalls Near 0.6670
A third consecutive weekly gain was achieved, but the spinning top doji signals the bullish AUD/USD rally is losing momentum. Price came close to testing the September high, but failed to break through. If US data prints soft enough to satisfy doves, the pair may get another attempt at 0.6700. However, any ambiguity in the data could trigger a pullback during a week that historically averages slightly negative returns.
On the daily chart, the rally stalled near the 0.6670 weekly VPOC. A hammer has formed, reinforcing the loss of upside momentum, while the October high at 0.6617 sits just below as initial support. Further downside levels to watch include 0.6600 and 0.6580, particularly if the US dollar rebounds from recent lows.
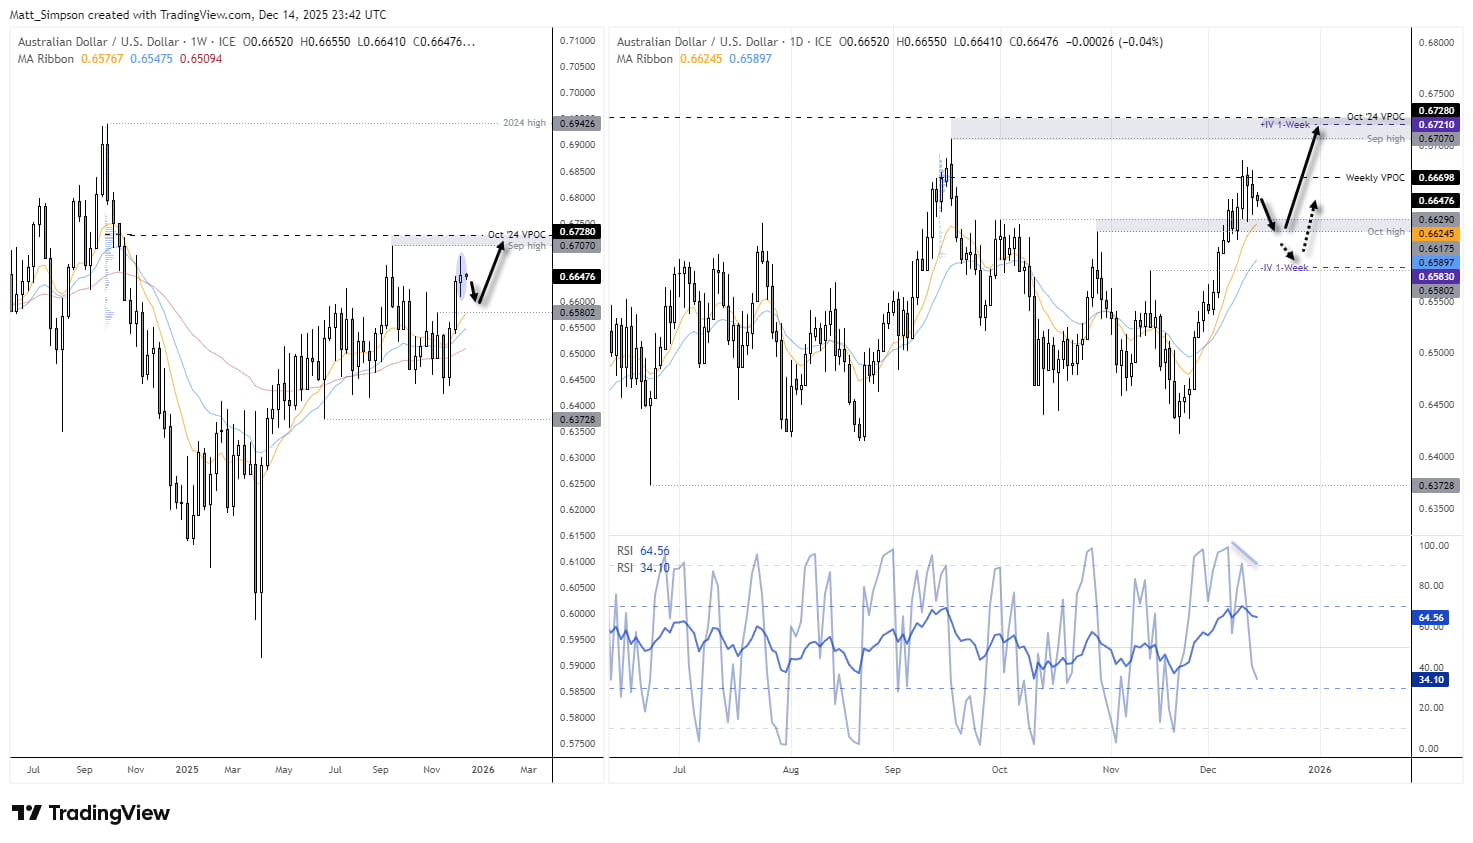
Chart analysis by Matt Simpson - data source: TradingView AUD/USD
That said, with bond differentials and risk reversals still supportive of the Australian dollar, I expect dips to be bought, with AUD/USD likely to make a push towards the October 2024 VPOC near 0.6728.

Chart analysis by Matt Simpson - data source: LSEG
View the full economic calendar
-- Written by Matt Simpson
Follow Matt on Twitter @cLeverEdge
How to trade with City Index
You can trade with City Index by following these four easy steps:
- Open an account, or log in if you’re already a customer
• Open an account in the UK
• Open an account in Australia
• Open an account in Singapore
- Search for the market you want to trade in our award-winning platform
- Choose your position and size, and your stop and limit levels
- Place the trade


