


The Australian dollar rally is starting to show signs of fatigue, even as spot AUD/USD continues to hold firm above the 70c handle. Futures traders have piled into long positions while options markets show a growing demand for downside protection, highlighting a disconnect between bullish positioning and rising caution. With Middle East tensions simmering and a rare week featuring both US CPI and PCE inflation data, traders could soon find out whether the Aussie’s resilience can continue or if a deeper pullback is about to unfold.
View related analysis:
- ASX 200 Outlook: Oil, Yields and Global Equities Drive Market Risk
- AUD/JPY Rattled at 35-Year High, Gold Probes 5000 as Volatility Spikes
- Australian Dollar Outlook: AUD/USD Bullish Bets Face Geopolitical Test
Australian Dollar Rally Starts to Fray at the Edges
The retracement on the Australian dollar has been slow and uneven against FX majors, with traders weighing up a hawkish RBA against risk-off flows stemming from the Middle East. While the Aussie can benefit from rising commodities driven by supply shocks, the 35% surge in oil prices hardly lays the groundwork for risk appetite. We could therefore continue to see choppy trade and inconsistency among FX majors until the turbulence recedes somewhat.
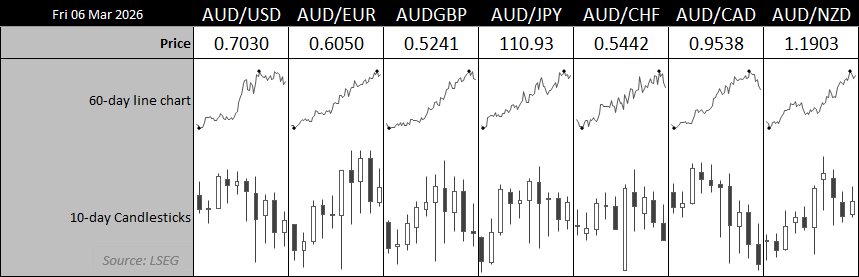
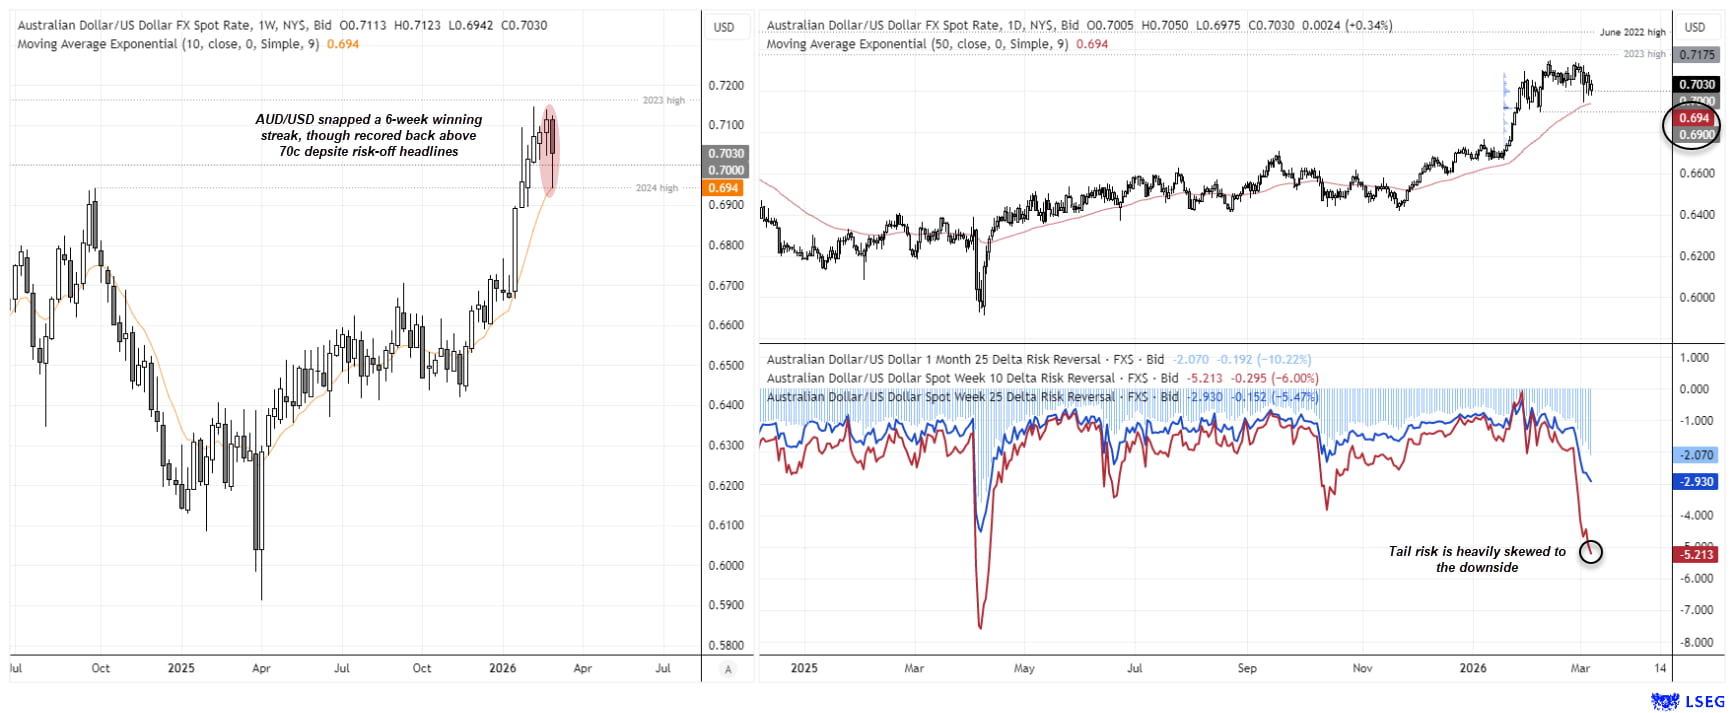
Source: LSEG
- AUD/USD snapped a 6-week winning streak, though support was found just above 69c and it closed back above 70c
- AUD/CAD formed a notable bearish engulfing candle, with Friday’s surge in crude oil prices supporting the Canadian dollar
- AUD/NZD reached a fresh 10-year high, though bulls failed to reach 1.20 and a wide-legged spinning top doji formed to suggest volatile indecision at the highs
- AUD/JPY and AUD/CHF closed flat, with traders favouring the US dollar over the Japanese yen for safety amid the conflict in the Middle East
- GBP/AUD snapped an 8-week losing streak with a bullish engulfing candle, warning of a potential swing low
- EUR/AUD rose for an 11th week, with its volatile doji providing the only minor clue of a correction
Australia This Week: Economic Data and Events for AUD/USD Traders
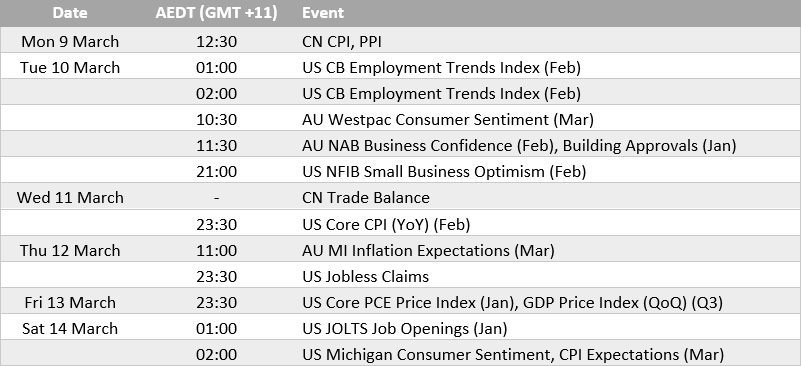
Middle East Headlines Overshadow Rare Double US Inflation Week
Middle East headlines will likely supersede the importance of the economic calendar. Which is a shame, because for once the US releases core CPI and core PCE in the same week, due to the backlog from the government shutdown. Though it could still prompt pockets of volatility, particularly if the data comes in hot.
Domestically, the pressure on the RBA to hike remains in place, though I’m not convinced they’re ready to act as soon as the March meeting. We have no major economic data scheduled ahead of it. Q4 GDP rose 2.6% y/y and 0.8% q/q, continuing a clear upward trend alongside inflation. Yet household spending rose just 0.3% in January, or 0.1% for discretionary spending. RBA cash rate futures imply around an 84% probability of a hike, so for now May could provide the next opportunity, when we have more employment and monthly inflation data to assess.

AUD/USD Technical Analysis: Australian Dollar vs US Dollar
AUD/USD Futures Positioning | COT Report
Futures traders continued to pile into Australian dollar longs, with net-long exposure reaching a 9-year high among large speculators and asset managers. Long positions rose by a combined 31k contracts, increasing 12.2% for large speculators and 12% for asset managers, while both groups also trimmed short positions.
The fact that this surge in longs arrived after the US strike on Iran suggests concerns around higher commodity prices and a hawkish RBA outweighed fears that risk aversion would weigh on the Aussie. However, that balance could shift if crude oil continues to surge at the pace seen last week.
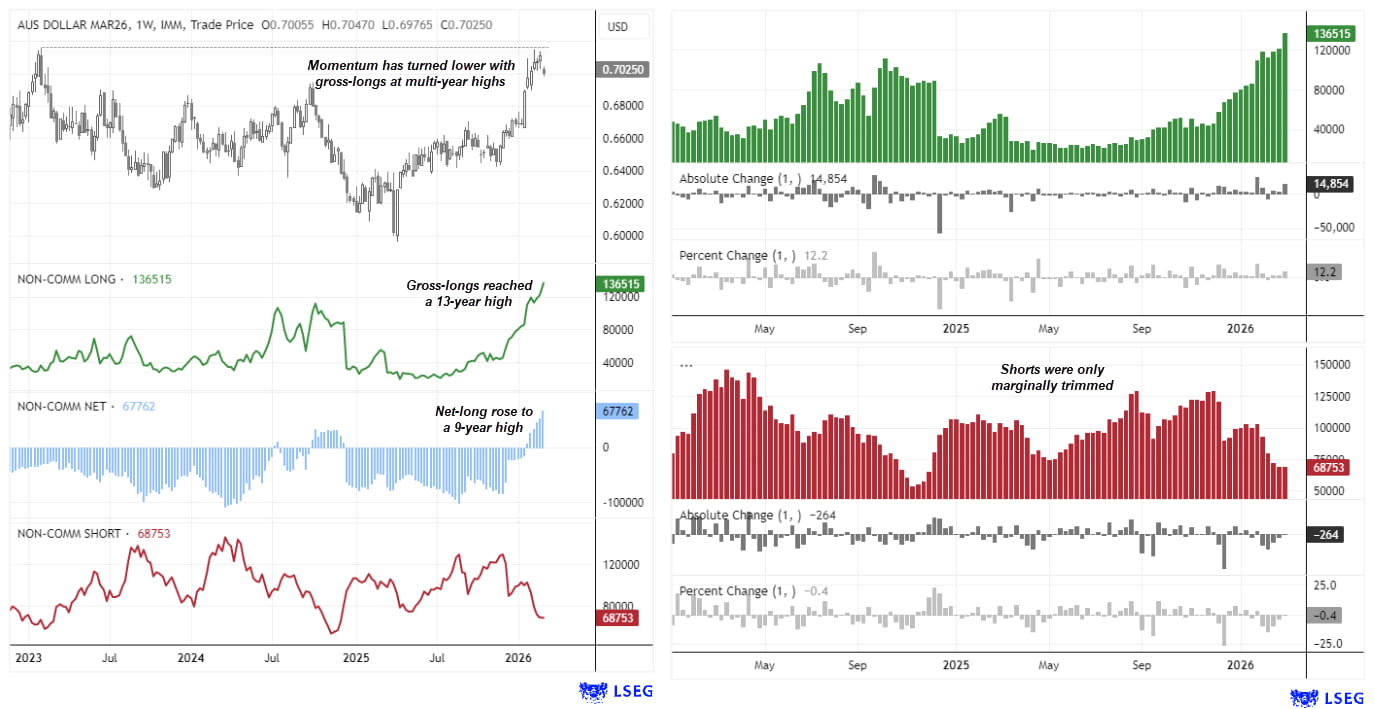
Source: CFTC, CME, LSEG
AUD/USD Correlations
Correlation data shows AUD remains heavily driven by the US dollar and broader risk sentiment. The strong inverse correlation with the US Dollar Index (around -0.96 over 10 days) highlights USD moves remain the dominant driver in the short term. Meanwhile, positive correlations with NZD and CNH reinforce the Aussie’s close ties to Asia-Pacific currencies and China-related sentiment.
The pair has also developed stronger short-term correlations with equities such as the S&P 500 and SPI 200, suggesting risk appetite (or lack of) is increasingly influencing price action. In contrast, correlations with copper and gold remain supportive yet more variable, while oil’s relationship has recently turned negative. Overall, the charts suggest AUD/USD is currently trading more like a risk-sensitive currency tied to USD direction and equity sentiment, rather than being purely driven by commodity prices.
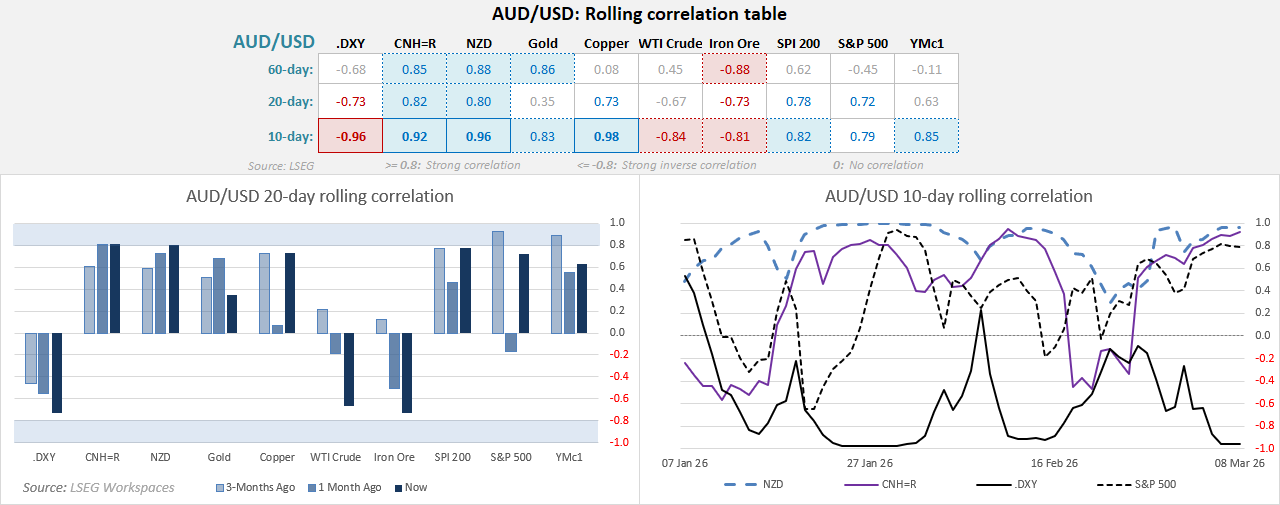
Source: LSEG
AUD/USD Options Markets Hedge Downside Risk
It wasn’t quite a bearish engulfing week, but it was close enough – and it did mark an end to the Aussie’s 6-week winning streak. Yet the 10-week EMA and the 2024 high came to the rescue, and bulls managed a close back above 70c, which is not bad considering the potential implications from the Middle East.
Options traders, however, are not taking any chances, with clear demand for downside protection. The 1-week 10-delta risk reversal – a gauge of downside tail risk – has plunged to a 9-month low. Investors also appear cautious over the near term, given the 1-week and 1-month 25-delta risk reversals have also fallen to a 9-month low, signalling a stronger demand for puts relative to calls.
So we may soon find out whether options traders are overpaying for downside protection, setting the stage for a rebound in AUD/USD, or whether spot traders have been too complacent and are about to see bearish follow-through.
The 69c handle appears to be the line in the sand. As long as prices hold above it, the potential for a move toward the 2023 high remains on the cards. Though such a move likely assumes a de-escalation in Middle East tensions.
Source: ICE, TradingView
View the full economic calendar
-- Written by Matt Simpson
Follow Matt on Twitter @cLeverEdge
How to trade with City Index
You can trade with City Index by following these four easy steps:
- Open an account, or log in if you’re already a customer
• Open an account in the UK
• Open an account in Australia
• Open an account in Singapore
- Search for the market you want to trade in our award-winning platform
- Choose your position and size, and your stop and limit levels
- Place the trade


