


RBA Holds Rates at 3.6%, Sees Only One Cut Likely in 2026
The RBA’s decision to hold their cash rate at 3.6% surprised few. Their updated forecasts suggest just a single rate cut in 2026, and likely closer to the second half than the first. While some are speculating that the RBA’s next rate change will now be a hike, I am not in that camp and still suspect a cut will arrive. Even if it is just the one. The RBA think the rise of inflation is temporary, so bets of another cut could be revived if quarterly inflation behaves itself, though we’ll need to wait until January to see those figures.
View related analysis:
- EUR/AUD, EUR/NZD Outlook: Euro Dominates Commodity Currencies
- 153 Remains Pivotal For USD/JPY, AUD/USD Stabilises with Wall Street Bounce
- US Dollar Probes 6-Month High, AUD/USD Steady Into RBA
- Australian Dollar Outlook: RBA, US ISM and ADP In Focus
Australian Dollar Performance
- AUD/USD snapped a three-week winning streak after the RBA held rates steady and lowered its easing outlook to just one cut next year.
- AUD/NZD climbed to a ten-year high as the New Zealand dollar weakened following a soft employment report, which boosted odds of a 50bp RBNZ cut in December.
- AUD/JPY erased the prior week’s gains, forming a mild bearish engulfing candle as the Japanese yen emerged as the strongest FX major of the week.
- The Australian dollar also lost ground to the euro (EUR/AUD +1%), British pound (GBP/AUD +0.8%), Canadian dollar (AUD/CAD –0.6%), and Swiss franc (AUD/CHF –0.6%).
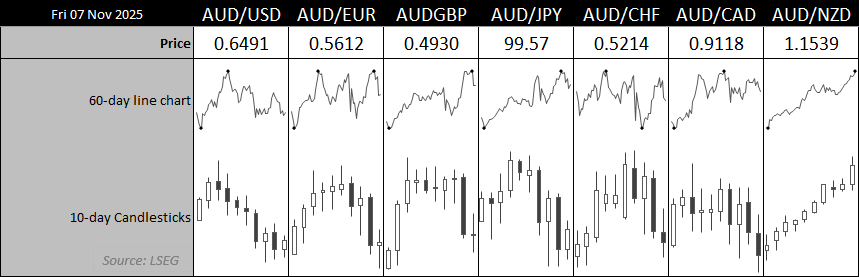
Chart prepared by Matt Simpson - Source: LSEG
Australia This Week: Economic Data and Events for AUD/USD Traders
|
Date |
AEDT (GMT +11) |
Event |
|
Sun 9 Nov |
12:30 |
CN CPI, PPI |
|
Mon 10 Nov |
11:30 |
AU Building Approvals (Revised) (Sep), Monthly Business Turnover Indicator (Sep) |
|
Tue 11 Nov |
10:30 |
AU Westpac Consumer Sentiment (Nov) |
|
|
11:30 |
AU NAB Business Confidence (Oct) |
|
|
19:30 |
CN Outstanding Loan Growth (YoY) (Oct) |
|
|
22:00 |
US NFIB Small Business Optimism (Oct) |
|
Wed 12 Nov |
11:30 |
AU Lending Indicators (Sep) |
|
Thu 13 Nov |
08:45 |
NZ Electronic Card Retail Sales (MoM) (Oct) |
|
|
11:30 |
AU Labour Force (Sep) |
|
Fri 14 Nov |
00:30 |
US Core CPI (Oct) |
|
|
08:30 |
NZ Business NZ PMI (Oct) |
|
|
13:00 |
CN Retail Sales, Unemployment, Industrial Production, Fixed Asset Investment (Oct) |

Australia’s Jobless Rate in Focus
The labour force report is Australia’s biggest economic event on Thursday. While the RBA had inflation as the bigger factor over any rate change decision ahead of last week’s meeting, they will surely take notice if the unemployment rate rises by another 0.2 percentage points.
Unemployment rose 0.2pp to a 4-year high of 4.5% in August. Their updated forecasts have the UE rate at 4.4% through to December 2027. Given the past four changes to the UE rate over the past ten months have been to the upside, the last two of which at 0.2pp, it is fair to say the jobless rate is increasingly at a faster rate. And a 4.7% print would be hard to ignore as it could reignite bets of an RBA cut.
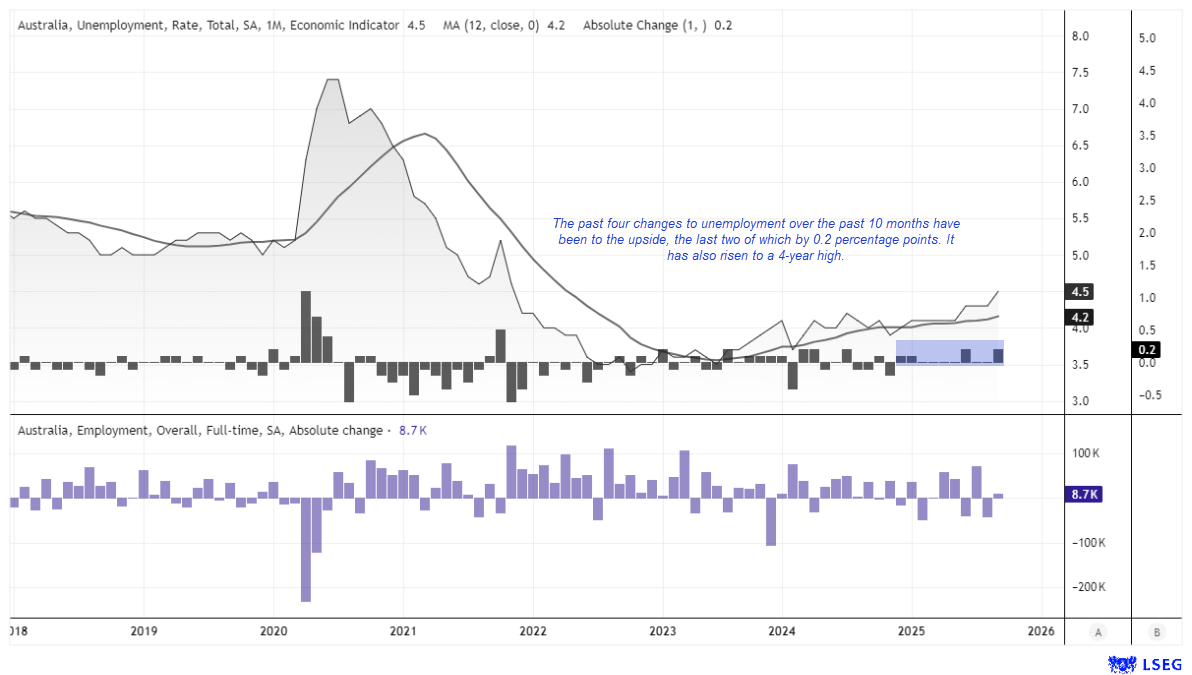
Chart prepared by Matt Simpson - Source: ABS, LSEG
US Inflation Could Gently Rise
US inflation seems more likely to creep higher than delivery a surprise miss this week. Both headline inflation and core CPI rose to 3% y/y in August, below the 3.1% expected, though from the limited data available amid the US government shutdown, gentle inflationary forces remain at play. ISM non-manufacturing rose to an 8-month high and the ‘prices paid’ component rose to a near 3-year high of 70. This should help support the US dollar and taper hopes of a December Fed cut. Especially since Jerome Powell has set a high bar for a December rate cut.
AUD/USD Correlations
- The rolling correlation between the Australian and New Zealand dollars masks the fact that AUD/NZD climbed to a ten-year high, rising for eleven consecutive sessions by Friday’s close.
- The typically inverse relationship between the US dollar and AUD/USD is now almost non-existent on the 10- and 20-day timeframes, though it remains firmly negative over the 60-day period.
- Correlation with copper remains strong on both the 10- and 20-day lookbacks, while WTI crude oil and iron ore also show solid short-term alignment with the Aussie.
- Risk appetite continues to be a major driver, with strong positive correlations between the Australian dollar, the S&P 500, and SPI 200 (ASX 200 futures).
- Meanwhile, the positive correlation between the Aussie and Chinese yuan (CNH) has weakened notably over the past two weeks.
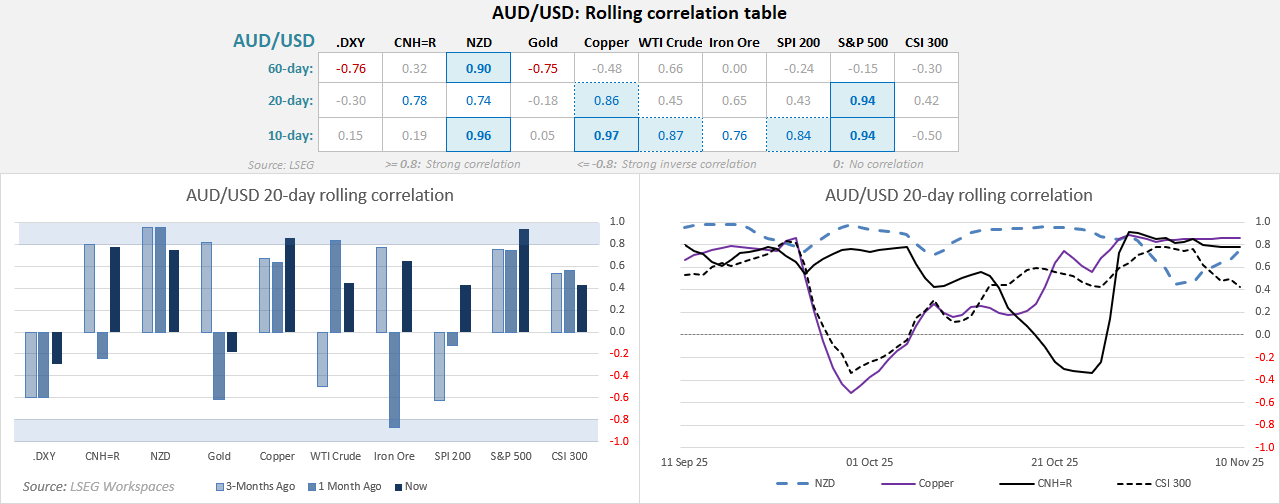
Chart prepared by Matt Simpson - Source: LSEG
AUD/USD Technical Analysis: Australian Dollar vs US Dollar
The Australian dollar snapped a three-week winning streak, forming a lower high around 0.66 on the weekly chart. From a price action perspective, this could signal renewed bearish pressure for the Aussie. However, with the US dollar index also posting a bearish reversal week (shooting star) around 100, downside for AUD/USD may be limited in the near term unless the upcoming US CPI report comes in hot.
The weekly RSI (14) sits near 50, indicating a lack of directional momentum on this timeframe.
The daily chart presents mixed signals, with several support and resistance levels clustered nearby. Three lower wicks have formed around the October close low, and Friday’s bullish inside day hints at a potential swing low. Bulls will need to reclaim the 200-day EMA (0.64955), though nearby resistance levels — the September close low (0.6515) and 0.6521 — could cap upside. A break above these would bring the monthly pivot point (0.6537) into focus.

If the US dollar regains strength later this week or next, AUD/USD could retreat toward the 200-day SMA (0.64479) near the monthly S1 pivot (0.6446). That move would likely require a combination of a weak Australian employment report and a stronger-than-expected US CPI reading.
For now, the bias leans toward a modest bounce from current levels, with gains likely contained below the monthly pivot. The broader trend bias remains mildly bearish toward 0.6440, suggesting traders may want to stay nimble and focus on shorter timeframes and holding periods.

Chart analysis by Matt Simpson - data source: TradingView AUD/USD
View the full economic calendar
-- Written by Matt Simpson
Follow Matt on Twitter @cLeverEdge
How to trade with City Index
You can trade with City Index by following these four easy steps:
- Open an account, or log in if you’re already a customer
• Open an account in the UK
• Open an account in Australia
• Open an account in Singapore
- Search for the market you want to trade in our award-winning platform
- Choose your position and size, and your stop and limit levels
- Place the trade


