


The Australian dollar outperformed its peers last week after strong inflation data dashed hopes of an RBA rate cut this year. With the central bank vindicated in its cautious stance, attention now shifts to upcoming employment figures and US data releases — including the ISM and ADP reports — for clues on the next move in AUD/USD.
View related analysis:
- Australian Dollar Outlook: AUD/USD Eyes Volatility Ahead of Fed, AU CPI
- ASX 200 Morning Market Outlook: Sectors Highlight Structural Weakness
- Gold Shows Tentative Signs Of Stability, Options Hint At Mild Recovery
- US Dollar Eyes Breakout as EUR/USD, GBP/USD Probe Support, USD/JPY Rallies
- The Nasdaq-to-Bitcoin Correlation Is Alive and Well (During Risk-Off)
RBA Vindicated as Hot Inflation Data Halts Rate-Cut Hopes
Australian Dollar Performance
- The Australian dollar was the strongest FX major last week, gaining the most traction against the British pound, Swiss franc, and euro.
- Strong inflation figures have killed all hopes of an RBA cut this week — and likely this year.
- AUD/JPY rose 3.1% in October, marking its most bullish month in 18.
- GBP/AUD formed a shooting star month, fell 1.7% last week, and briefly probed 2.0 on the combination of hot Australian CPI and increased odds of Bank of England (BoE) cuts.
- EUR/AUD formed a bearish outside month, fell for a second week, and bears are now eyeing a break of its October low.
- A bullish pinbar month formed on AUD/CHF after a false break of 0.5164, and it rose for a second consecutive week.
- AUD/NZD climbed for a fifth month, though it formed an inverted hammer below the 2022 high — hinting at potential weakness within its bullish trend.

Chart prepared by Matt Simpson - Source: LSEG
RBA Vindicated as Hot Inflation Data Halts Rate-Cut Hopes
The RBA have taken plenty of stick from pundits for not cutting rates sooner, with each policy statement accompanied by lingering concerns over inflation. Well, they likely feel vindicated following the release of the Q3 figures — even if it puts them in a tricky position. Trimmed mean CPI rose 1% q/q, above Governor Bullock’s own 0.9% threshold to justify holding rates at this week’s meeting. The trimmed mean also climbed to 3% y/y, the top of the RBA’s 2–3% target band, while the weighted mean rose to an uncomfortable 3.2%.
Not only is an RBA rate cut this week dead and buried, but the latest data also casts doubt on whether the Bank will cut at all this year — and raises the question of whether we’ve already seen the terminal rate at 3.6%. Unless unemployment spikes and employment begins to roll over, it’s hard to see the RBA cutting again before the next quarterly CPI figures drop on 28 January.
RBA cash rate futures imply just a 7% chance of a cut this week, down from 81% just two weeks ago.

Focus Shifts to Labour Data After Hot Inflation Report
While Governor Bullock made it clear she was more concerned about inflation than rising unemployment ahead of the hot inflation report, that doesn’t make employment data insignificant. Traders can use smaller employment-related releases to gauge whether the labour market is starting to weaken. ANZ’s job advertisements data, released on Monday at 11:30, showed a -3.5% decline in September — the fastest contraction since December 2023. If this trend continues, it could build expectations for a softer jobs report and a higher unemployment rate. It’s also worth noting that ANZ announced 3,500 job cuts over the next year back in September — and banks tend to follow one another with such moves.
Employment and inflation trends can also be tracked through the Judo Bank PMIs and AIG construction and manufacturing reports. While these releases rarely generate significant reactions in AUD/USD, they can collectively help shape RBA policy expectations at the margin.
Australia This Week: Economic Data and Events for AUD/USD Traders

Chart prepared by Matt Simpson: Source – Investing.com
Powell Pushes Back on December Cut, Jobs Data in Focus
The Federal Reserve cut its policy rate by 25 basis points this week, bringing the target range down to 3.75%–4.00%. Chair Jerome Powell cautioned that a December cut is not a given, signalling that policymakers remain data-dependent and cautious.
While inflation remains elevated, the Fed’s tone suggests growing concern over the cooling labour market. With jobs growth slowing and wage pressures easing, upcoming employment indicators — particularly the ADP report — could carry extra weight for the US dollar’s reaction, especially if a weak print revives Fed-cut expectations.
The ISM manufacturing and services reports will also help reveal underlying trends in growth, employment and inflation. Of the two, the services report carries greater potential to move global sentiment — and therefore the Australian dollar.

AUD/USD Correlations
- The positive correlation between the Australian dollar and Wall Street’s appetite for risk has returned, alongside its lockstep moves with the Chinese yuan.
- The 10-day correlation between the S&P 500 and AUD/USD has risen to 0.92, while the 20-day sits at 0.89 — both indicating a strong relationship. To put this in perspective, the 60-day correlation is effectively zero, showing how quickly this relationship has re-emerged.
- The strongest relationship is with the Chinese yuan, as the 10-day USD/CNH to AUD/USD correlation has rien to 0.93 over the past 10 days and 0.85 over the past 20.
- On the China theme, the copper–AUD/USD correlation stands at 0.83 over the past 20 days though it has dropped to 0.59 over 10 days.
- Meanwhile, the positive correlation between NZD/USD and AUD/USD is diminishing, allowing AUD/NZD to edge higher amid diverging policy expectations between the RBNZ and RBA.
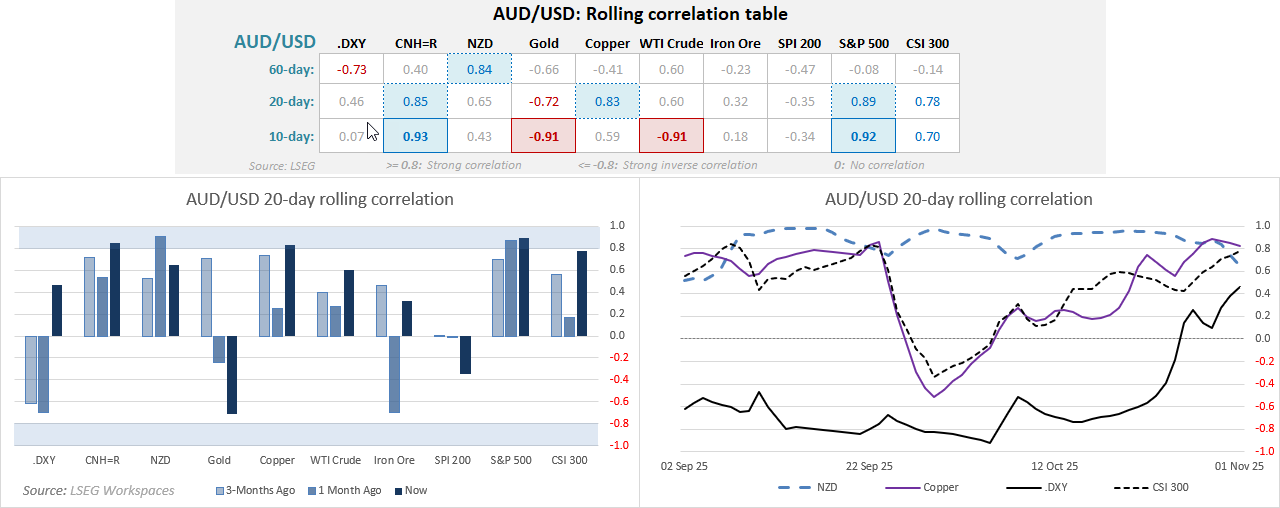
Chart prepared by Matt Simpson - Source: ABS, LSEG
AUD/USD Technical Analysis: Australian Dollar vs US Dollar
Last week I outlined the view that the pullback in the Australian dollar would likely be limited — and that bias remains intact. Risk reversals continue to support a shallow retracement, with demand for puts (bearish bets) only rising slightly as the Aussie dipped last week.
However, the weekly chart shows an elongated shooting star candle, with the Aussie giving back around two-thirds of its earlier gains. This suggests any subsequent rally may take time to develop, and we could be in for a quiet start to the week unless a fresh catalyst emerges.
The daily chart shows AUD/USD has now declined for a third consecutive day, though it closed on its 50-day EMA and above the prior consolidation pattern. Bearish momentum is fading, although the daily RSI (2) is yet to reach oversold territory.
The bias this week is to seek dips. We may see evidence of a swing low forming around current levels, but moves towards 0.6500 — just above the 200-week EMA and a high-volume node (HVN) — could also be considered attractive for buyers.

Chart analysis by Matt Simpson - data source: TradingView AUD/USD
View the full economic calendar
-- Written by Matt Simpson
Follow Matt on Twitter @cLeverEdge
How to trade with City Index
You can trade with City Index by following these four easy steps:
- Open an account, or log in if you’re already a customer
• Open an account in the UK
• Open an account in Australia
• Open an account in Singapore
- Search for the market you want to trade in our award-winning platform
- Choose your position and size, and your stop and limit levels
- Place the trade


