


Softer labour data has taken some of the shine off AUD/USD’s recent run, reminding traders that rallies driven by policy expectations need continual upside surprises to sustain. With the RBA delivering an expected hawkish hold and the Aussie already up more than 4%, today’s employment figures offer a timely reality check for bulls as the pair approaches a key resistance zone.
View related analysis:
- ASX 200 Market Outlook: CBA Looks Set to Bounce, Make or Break for BXB
- ASX 200 Market Outlook: All Sectors See Red After Hawkish RBA Hold
- Gold Grinds Unconvincingly Higher, USD Holds Ground Into FOMC
- S&P 500 Seasonality: How Santa's Rally Across Wall Street Stacks Up
Australian Jobs Reports Statistics:
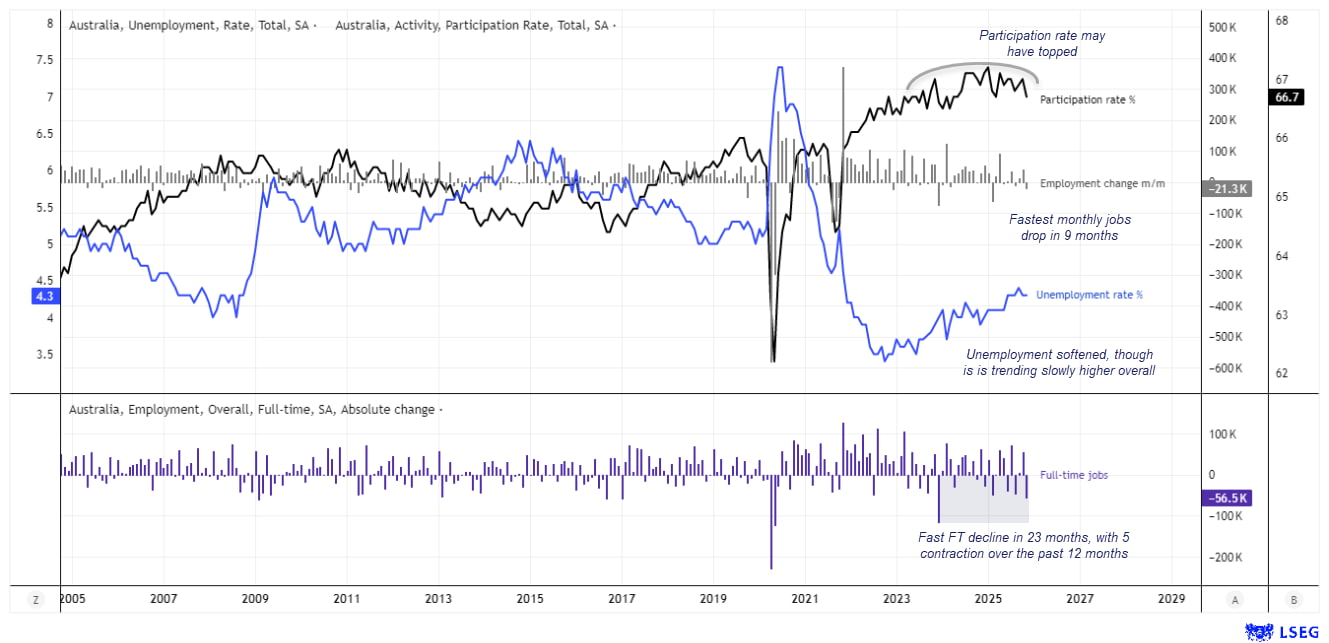
- Seasonally adjusted, unemployment remained at 4.3% - -0.2 percentage points from its 4-year high of 4.5%
- Employment fell by -21.3k in November, its fastest monthly drop in nine months
- Full-time employment fell -56.6k, its fastest monthly contraction in nearly two years (or negative prints over the past year)
- The participation rate slows to an 8-molnth low of 66.7%, further suggesting it may have topped in late 2024

Australia Labour Market: Implications for the RBA and AUD/USD
The RBA will view the labour market as slightly less tight than before its last meeting, though far from weak. The drop in full-time employment becomes more relevant if December registers the first consecutive declines since the pandemic.
If inflation continues drifting higher — which the RBA appears to anticipate — February remains a live meeting. The only scenario that materially reduces that risk is a softer January labour report paired with cooler Q4 CPI on 26 January.
Even if the RBA hikes in February, today’s numbers don’t persuade me they would follow up with another increase.
Charts prepared by Matt Simpson, Source: LSEG
AUD/USD Technical Analysis: Australian Dollar vs US Dollar
AUD/USD Nears Key Resistance as Weekly Momentum Stretches
The Australian dollar is on track for a third straight bullish week. The weekly RSI(2) is edging into overbought territory (90+), and price is closing in on the September high. December seasonality typically leans AUD/USD-positive — or USD-negative — especially in the second half of the month, so a push toward the September high remains on the table.
But with momentum already fading and the year’s strongest data now behind us, bulls may want to stay nimble if AUD/USD makes a run at 0.67.
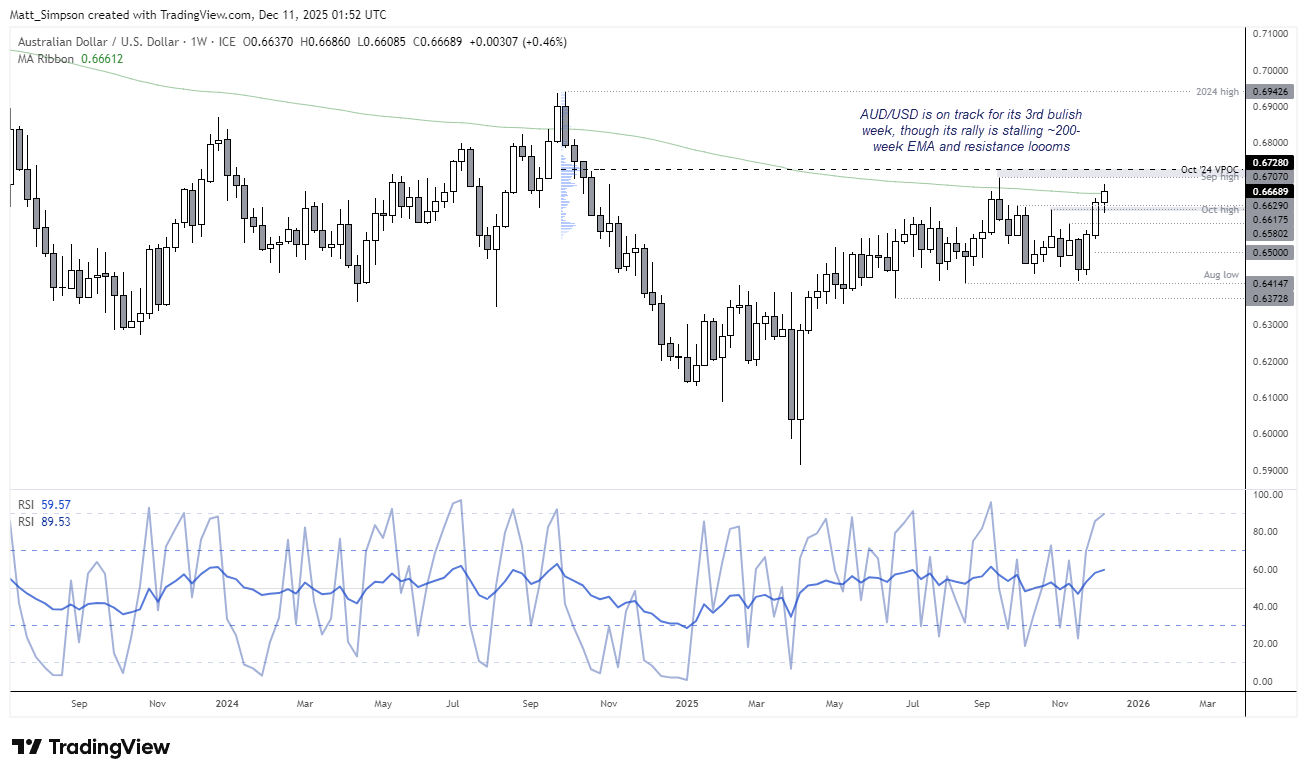
Chart analysis by Matt Simpson - data source: TradingView AUD/USD

AUD/USD Nears Key Resistance as Weekly Momentum Stretches
The daily chart shows prices flat on the day, with traders taking the softer jobs data in stride. Even so, the rally has stalled around a weekly VPOC at 0.6670 and the monthly R2 pivot near 0.6680.
If we see a pullback I suspect it will be minor, and dip buyers would see retracement down to the October high as a gift. But once the current pause for breath is done and dusted, a move to 67c seems quite likely, with a break of the September high bringing the October 2024 VPOC into focus.

Chart analysis by Matt Simpson - data source: TradingView
View the full economic calendar
-- Written by Matt Simpson
Follow Matt on Twitter @cLeverEdge
How to trade with City Index
You can trade with City Index by following these four easy steps:
- Open an account, or log in if you’re already a customer
• Open an account in the UK
• Open an account in Australia
• Open an account in Singapore
- Search for the market you want to trade in our award-winning platform
- Choose your position and size, and your stop and limit levels
- Place the trade


