


The Australian dollar is entering a tactically interesting phase, with price action diverging across key crosses. While AUD/USD momentum is rolling over near major volume and trend levels, EUR/AUD is showing early signs of a corrective bounce within a broader bearish structure. At the same time, AUD/JPY remains stretched following a powerful rally, leaving traders caught between trend continuation and intervention risk.
View related analysis:
- USD/JPY Outlook: Yen Bears Push Toward 160 as Intervention Risks Rise
- Australian Dollar Outlook: AUD/USD Momentum Falters Near Highs
- AUD/USD Hints at Pullback as US Dollar Bulls Regain Footing
- AUD/USD 2026 Outlook: Policy Divergence and a Shifting Dollar Trend
Australian Dollar Technical Setups
AUD Price Action Themes
Momentum is fragmenting across AUD pairs, with downside risks building against the US dollar, corrective potential emerging against the euro, and trend exhaustion risks rising against the yen.
Australia’s FX Outlook
AUD weakness is becoming more selective rather than broad-based, suggesting traders should stay tactical rather than directional across crosses.
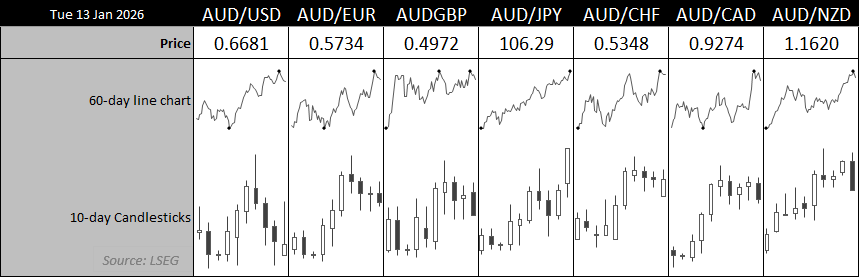
Chart source: LSEG
AUD/USD Technical Analysis: Australian Dollar vs US Dollar
On Monday, I outlined my bias for AUD/USD to retrace to at least 0.6640 near its December VPOC (volume point of control), and momentum is now turning in the call’s favour. The Aussie enjoyed a decent bounce from mid-November through to last week’s high, before momentum reversed and left a weekly shooting-star candle around the 67c handle.
Risk reversals are also pointing lower, showing a pick-up in puts relative to calls. However, implied volatility has yet to rise despite growing odds that the US could become actively involved in Iran — a move that would likely spark a bout of risk-off sentiment and weigh on risk-sensitive currencies such as the Australian dollar.
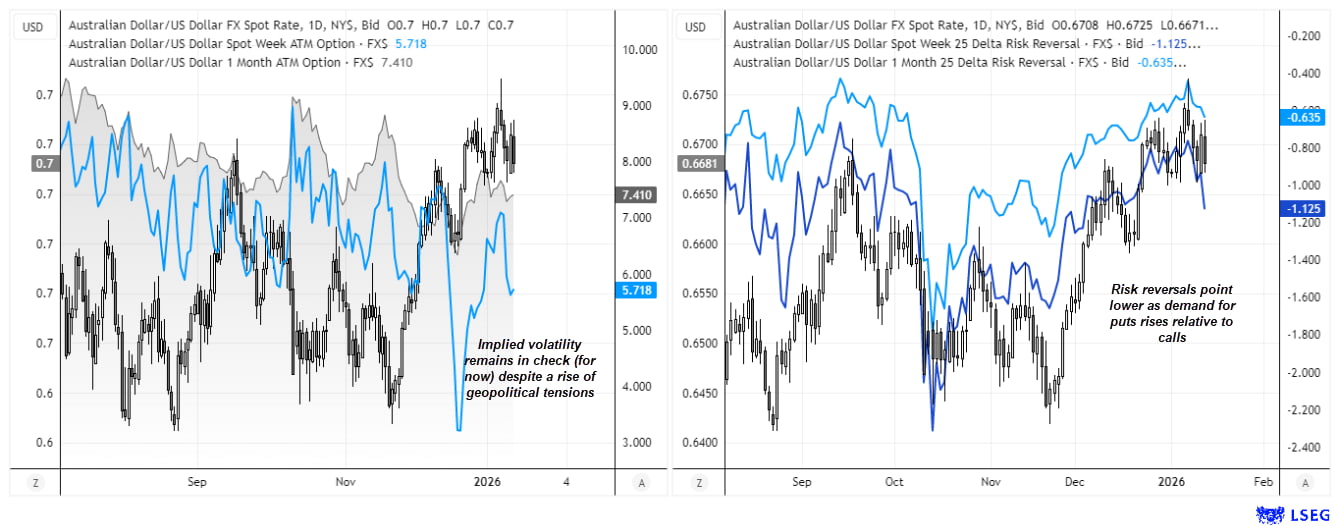
Chart analysis by Matt Simpson - source: LSEG
With prices near the lows of last week’s bearish pinbar, a break below it brings the 10-week EMA (exponential moving average) around 0.6640 and the monthly pivot point into focus for AUD/USD bears. A move below that level would then bring the 66c handle into view near the 20-week EMA. And with Tuesday printing a bearish engulfing candle at the October 2024 VPOC (volume point of control) and pushing prices back down to the 20-day EMA, the Aussie may be setting up for a dip lower sooner rather than later.
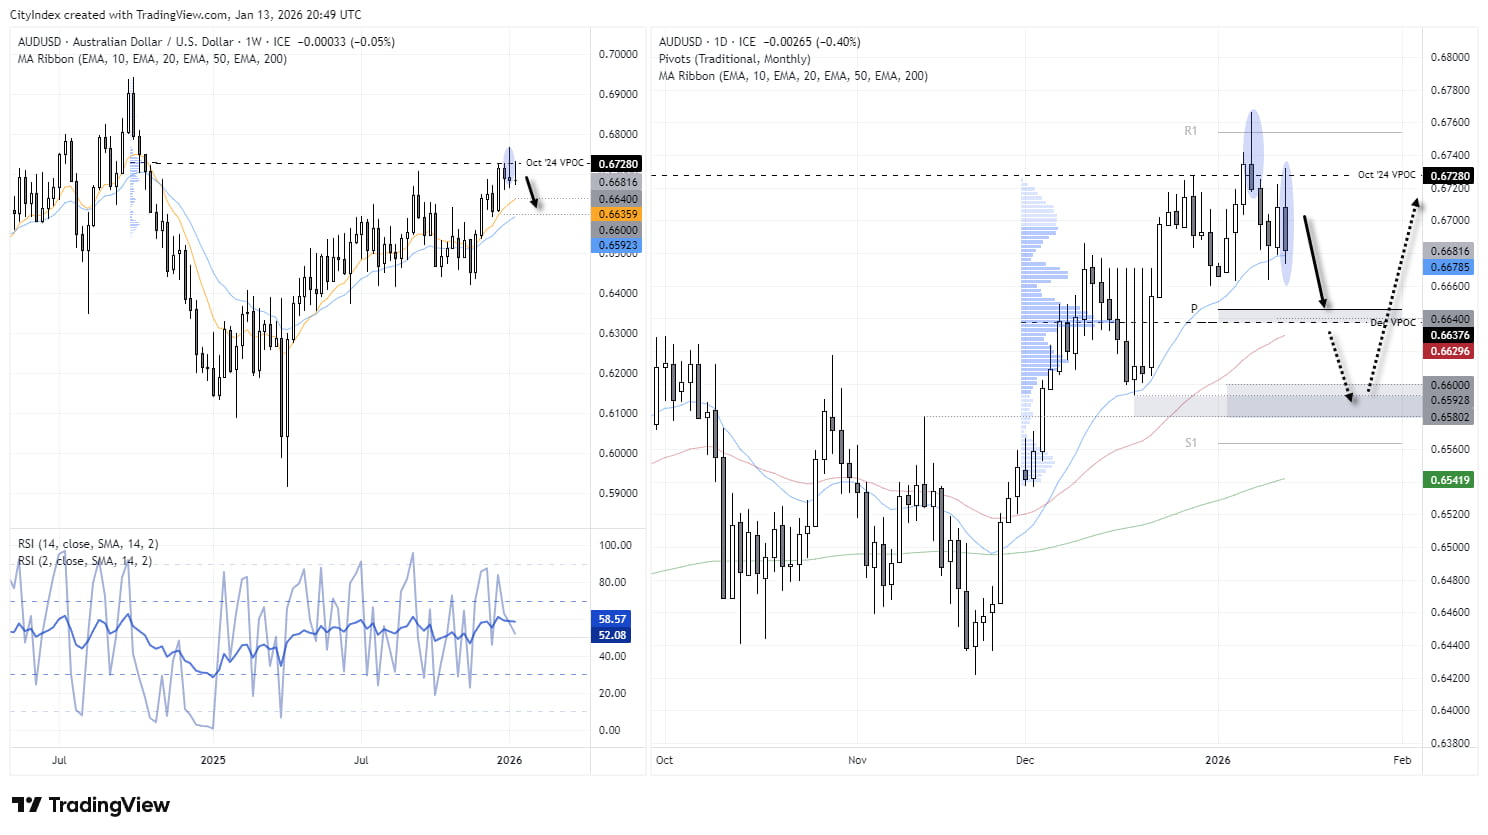
Chart analysis by Matt Simpson - source: TradingView AUD/USD

EUR/AUD Technical Analysis: Euro vs Australian Dollar
While a broader bearish move in EUR/AUD is underway — and one that still has scope to accelerate lower — near-term price action points to the potential for a countertrend bounce.
A doji formed on the daily chart at the 1.73 handle last week, and Tuesday’s bullish engulfing candle suggests a higher low is forming while testing the monthly S1 pivot point. A break above this level would signal scope for a deeper retracement.
Near-term upside targets for EUR/AUD bulls include the December VPOC (volume point of control) at 1.7540, the 200-day EMA (exponential moving average) near 1.7572, and the 1.76 handle. A break above the monthly pivot point at 1.7626 would invalidate the prior swing high and negate the near-term bullish bias.
Beyond any anticipated bounce, my broader bias remains for EUR/AUD to fall towards the 1.70 handle over time.
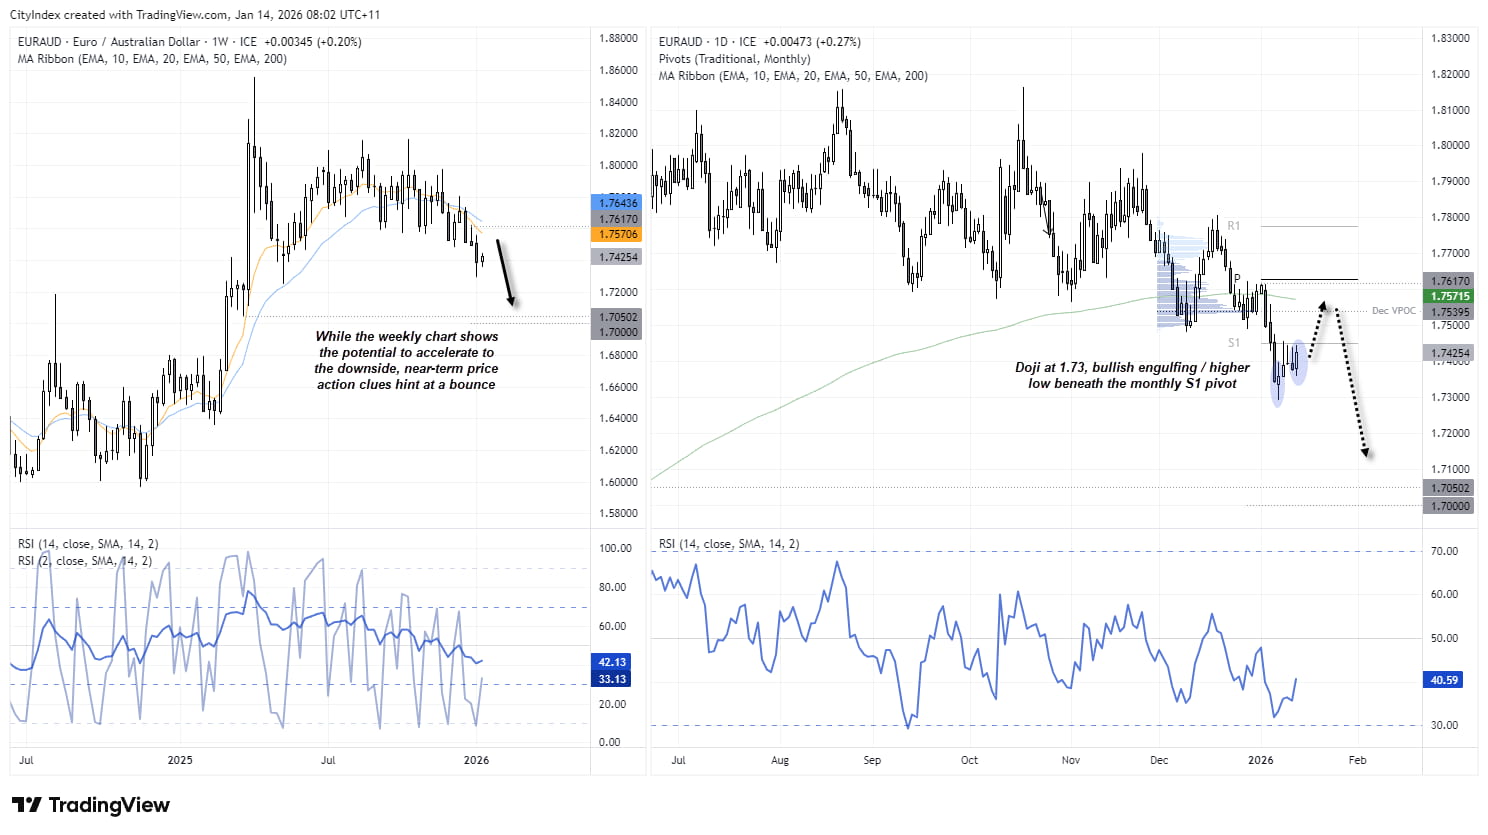
Chart analysis by Matt Simpson - source: TradingView

AUD/JPY Technical Analysis: Australian Dollar vs Japanese Yen
The Australian dollar has taken full advantage of a weaker Japanese yen since its April low, with AUD/JPY up around 24% amid a lack of intervention from Japan’s Ministry of Finance (MOF) and an insufficient pace of rate hikes from the Bank of Japan (BOJ).
However, if yen bears continue to push USD/JPY sharply higher in an effort to provoke MOF intervention, that could disrupt the trend and trigger a sharp pullback in AUD/JPY. By contrast, a steady and orderly depreciation in the yen reduces the urgency for intervention and could allow AUD/JPY to continue grinding higher.
Either way, bulls may want to tread carefully at these levels. A shooting-star candle formed at 17-month highs on Tuesday, with prices now extended from the 10-day EMA (exponential moving average) — a dynamic support that has underpinned the rally in recent weeks.
Bulls may prefer to wait for a low-volatility pullback towards the 10-day EMA to assume trend continuation. Bears looking to fade this strong uptrend may have the MOF as a potential catalyst if timed perfectly, although the clear risk is “death by a thousand cuts” via repeated stop-outs if Japan’s authorities remain on the sidelines.

Chart analysis by Matt Simpson - source: TradingView
View the full economic calendar
-- Written by Matt Simpson
Follow Matt on Twitter @cLeverEdge
How to trade with City Index
You can trade with City Index by following these four easy steps:
- Open an account, or log in if you’re already a customer
• Open an account in the UK
• Open an account in Australia
• Open an account in Singapore
- Search for the market you want to trade in our award-winning platform
- Choose your position and size, and your stop and limit levels
- Place the trade


