


The RBA’s decision to hold the cash rate at 3.65% came as no surprise, though the tone was a touch more hawkish than some expected. The opening paragraph of the statement acknowledged that early reads of inflation suggest CPI could come in hotter for Q3 than assumed in the August Statement on Monetary Policy (SOMP). Policymakers also noted that private demand — most notably household consumption — remains a key driver of growth. These are not the words one expects from a central bank preparing to cut rates. As a result, the Australian dollar (AUD) was the strongest FX major on Tuesday, with shorts scrambling to cover as bond yields tracked higher.
View related analysis:
- ASX 200 Morning Market Outlook: ASX Snaps 5-Month Winning Streak
- AUD/USD, AUD/JPY: Australian Dollar Diverges Against US Dollar and Yen
- Japanese Yen Price Action Setups: USD/JPY, AUD/JPY, GBP/JPY
AUD/USD Technical Analysis: Australian Dollar vs US Dollar
With the RBA’s next rate cut being priced out, the swing low on AUD/USD may have arrived earlier than expected. The Australian dollar has now posted three consecutive daily gains, each marked by increasing bullish volatility.
That said, it’s uncertain whether AUD/USD can immediately break to fresh cycle highs. The US dollar index remains prone to short covering, while the resistance cluster around the September high — which also aligns with the November high and two 200-day moving averages — could prove difficult for bulls to clear.
With prices hovering just beneath the July high, some mean reversion on lower timeframes may be due before a sustained breakout higher.

Chart analysis by Matt Simpson - data source: TradingView AUD/USD

AUD/JPY Technical Analysis: Australian Dollar vs Japanese Yen
While momentum has yet to turn decisively higher on AUD/JPY, my bullish bias from last week remains intact. The pair has held a steady bullish structure since the August low, with price consolidating above the July high and the 97.24 high-volume node (HVN).
Tuesday’s long-legged doji formed a higher low above last week’s morning star reversal, reinforcing evidence of underlying demand. Dips within Tuesday’s range may offer opportunities for bulls anticipating further gains. The 99 handle near the year-to-date high remains the first upside target, with a break above bringing the 100 handle into focus.

Chart analysis by Matt Simpson - data source: TradingView AUD/JPY
GBP/AUD Technical Analysis: British Pound vs Australian Dollar
GBP/AUD Technical Analysis: Monthly Chart
Price action on the monthly GBP/AUD chart suggests a major cycle high may have formed in April. A shooting star candle marked the end of the rally from the 2022 low, while September’s bearish engulfing pattern signals momentum has shifted against the bulls.
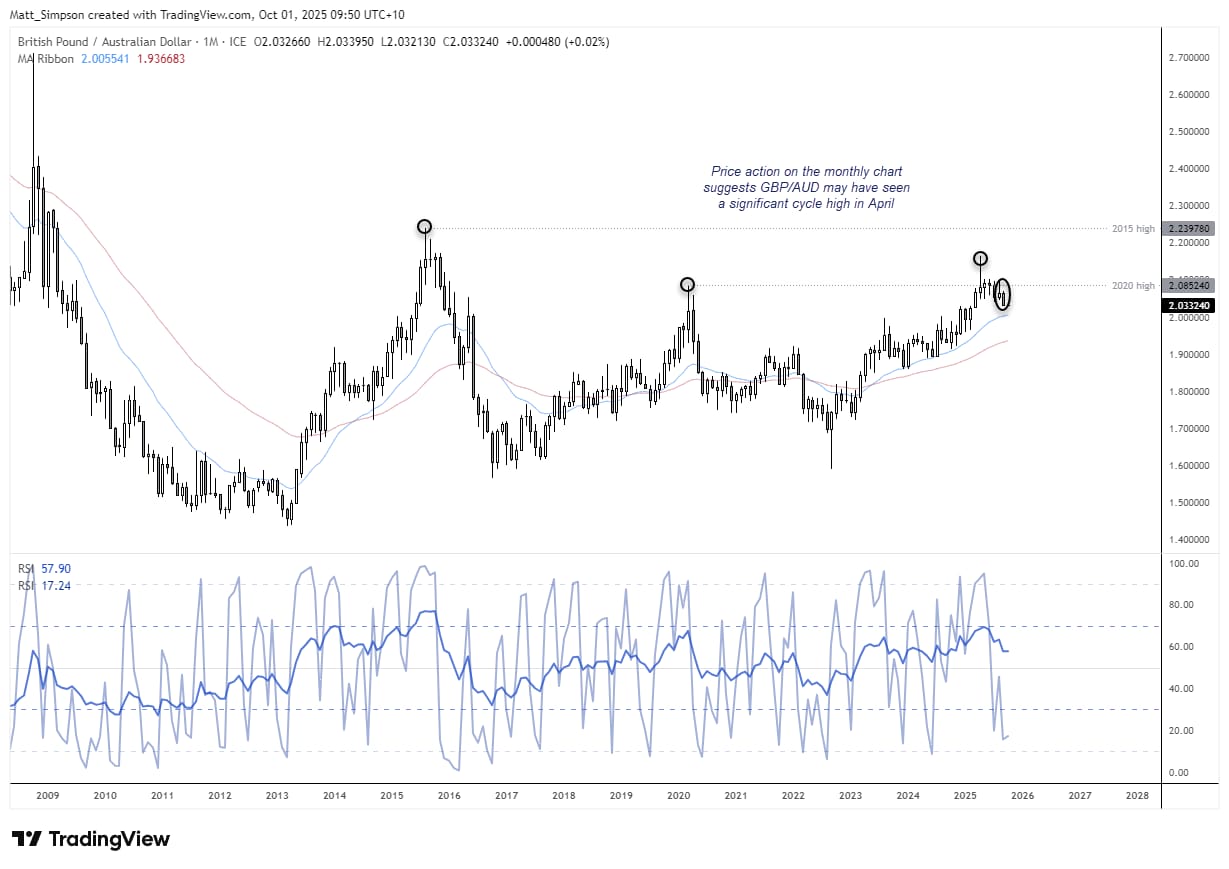
Chart analysis by Matt Simpson - data source: TradingView GBP/AUD

GBP/AUD Technical Analysis: Daily Chart
The Australian dollar has been trending lower against the British pound since the August high six weeks ago. Over this period, GBP/AUD has seen little in the way of a pullback, and momentum has turned lower again after a two-week consolidation around the 200-day SMA. That moving average has since acted as resistance, and GBP/AUD is now on the verge of breaking beneath the December high. Given the strength of the bearish trend, a move below the February high also looks likely.
Should GBP/AUD bears prevail, a retest of the 2.00 handle or the February VPOC (1.9794) could be on the cards.
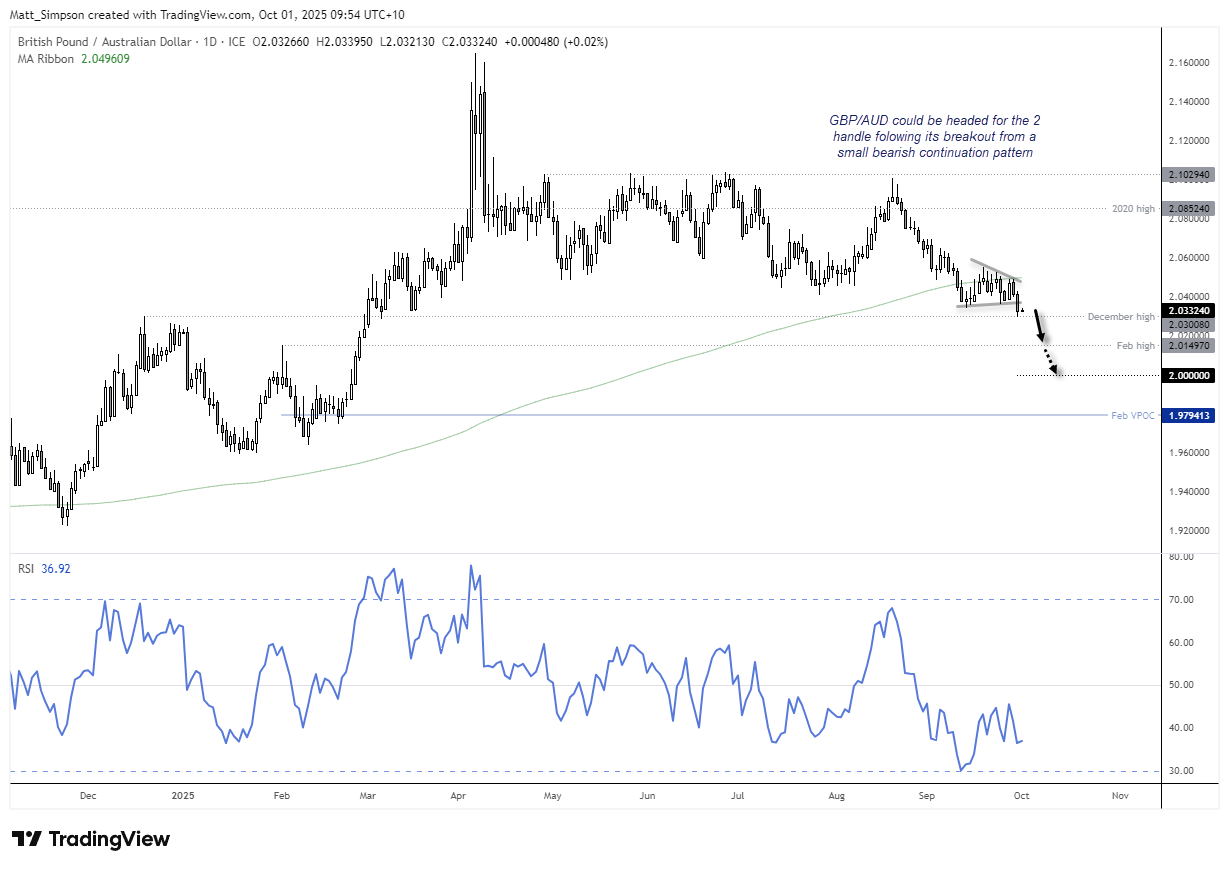
Chart analysis by Matt Simpson - data source: TradingView GBP/AUD
Key Economic Events for Traders (AEST / GMT+10)
09:50 JPY Tankan Index (Q3) (USD/JPY, EUR/JPY, Nikkei 225)
10:30 JPY au Jibun Bank Manufacturing PMI (Sep) (USD/JPY, EUR/JPY, Nikkei 225)
11:30 AUD RBA Chart Pack Release (AUD/USD, AUD/JPY, AUD/NZD)
16:00 GBP Nationwide HPI (Sep) (GBP/USD, EUR/GBP, FTSE 100)
16:30 CHF Retail Sales (Aug) (USD/CHF, EUR/CHF, CHF/JPY)
16:30 AUD Commodity Prices (Sep) (AUD/USD, AUD/JPY, AUD/NZD)
17:30 EUR ECB's Elderson Speaks (EUR/USD, EUR/GBP, DAX)
17:55 EUR HCOB Germany Manufacturing PMI (Sep) (EUR/USD, EUR/GBP, DAX)
17:55 EUR ECB's De Guindos Speaks (EUR/USD, EUR/GBP, DAX)
18:00 EUR HCOB Eurozone Manufacturing PMI (Sep) (EUR/USD, EUR/GBP, DAX)
18:30 GBP S&P Global Manufacturing PMI (Sep) (GBP/USD, EUR/GBP, FTSE 100)
19:00 EUR German Buba Mauderer Speaks (EUR/USD, EUR/GBP, DAX)
19:00 EUR Core CPI, CPI, HICP ex Energy & Food (Sep) (EUR/USD, EUR/JPY, DAX)
19:30 EUR German 10-Year Bund Auction (EUR/USD, EUR/GBP, Bund futures)
19:55 GBP BoE MPC Member Mann Speaks (GBP/USD, EUR/GBP, GBP/JPY)
20:00 USD OPEC Meeting (WTI Crude, Brent Crude, USD/CAD)
21:00 EUR German Buba President Nagel Speaks (EUR/USD, EUR/GBP, DAX)
22:15 USD ADP Nonfarm Employment Change (Sep) (S&P 500, Nasdaq 100, USD/JPY)
23:30 CAD S&P Global Manufacturing PMI (Sep) (USD/CAD, EUR/CAD, CAD/JPY)
23:45 USD S&P Global Manufacturing PMI (Sep) (S&P 500, Nasdaq 100, USD/JPY)
00:00 USD Construction Spending, ISM Manufacturing PMI (Sep) (S&P 500, Nasdaq 100, USD/JPY)
00:30 USD Crude Oil Inventories, EIA Refinery Crude Runs, Crude Oil Imports, Cushing Crude Oil Inventories, Distillate Fuel Production, EIA Weekly Distillates Stocks, Gasoline Production, Heating Oil Stockpiles, EIA Weekly Refinery Utilization Rates, Gasoline Inventories (WTI Crude, Brent Crude, USD/CAD)
02:15 USD FOMC Member Barkin Speaks (S&P 500, Nasdaq 100, USD/JPY)
03:00 USD Atlanta Fed GDPNow (Q3) (S&P 500, Nasdaq 100, USD/JPY)
03:30 CAD BoC Summary of Deliberations (USD/CAD, EUR/CAD, CAD/JPY)
04:05 CAD BoC Senior Deputy Governor Rogers Speaks (USD/CAD, EUR/CAD, CAD/JPY)


