


The Australian dollar was the strongest major currency on Monday after concrete steps from the US Senate to potentially end the government shutdown boosted risk appetite. The US dollar lost some of its safe-haven appeal, slipping against the British pound, Canadian dollar, and Japanese yen. The return to risk saw the Aussie rise across the board, with traders refocusing on a less-dovish RBA stance ahead of Thursday’s employment report.
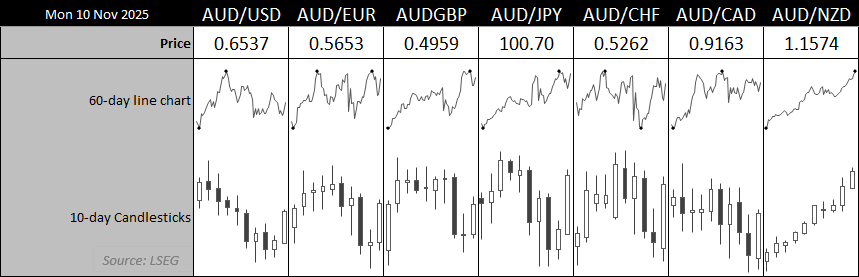
Chart analysis by Matt Simpson - source: LSEG
View related analysis:
- Australian Dollar Outlook: RBA Hold Puts Focus on AU Jobs, US CPI
- EUR/AUD, EUR/NZD Outlook: Euro Dominates Commodity Currencies
- 153 Remains Pivotal For USD/JPY, AUD/USD Stabilises with Wall Street Bounce
- ASX 200 Morning Outlook: Bulls Regain Control With Broad Sector Rebound
AUD/USD, EUR/AUD, and GBP/AUD Technical Setups
AUD/USD Technical Analysis: Australian Dollar vs US Dollar
In yesterday’s weekly AUD/USD outlook, I outlined a bias for the Aussie to rise toward the monthly pivot point at 0.6537 before reversing lower. However, given recent developments, there is now potential for AUD/USD to extend higher after a minor pullback.
The daily chart shows a firm close above the 0.6520 support and a strong rebound from the October close low, shifting the bias toward the October VPOC and potentially the 0.66 handle.
That said, a small bearish divergence has appeared on the 1-hour chart, with prices meeting resistance at the monthly pivot point. A short retracement within Monday’s range could precede the next leg higher if bullish momentum resumes.
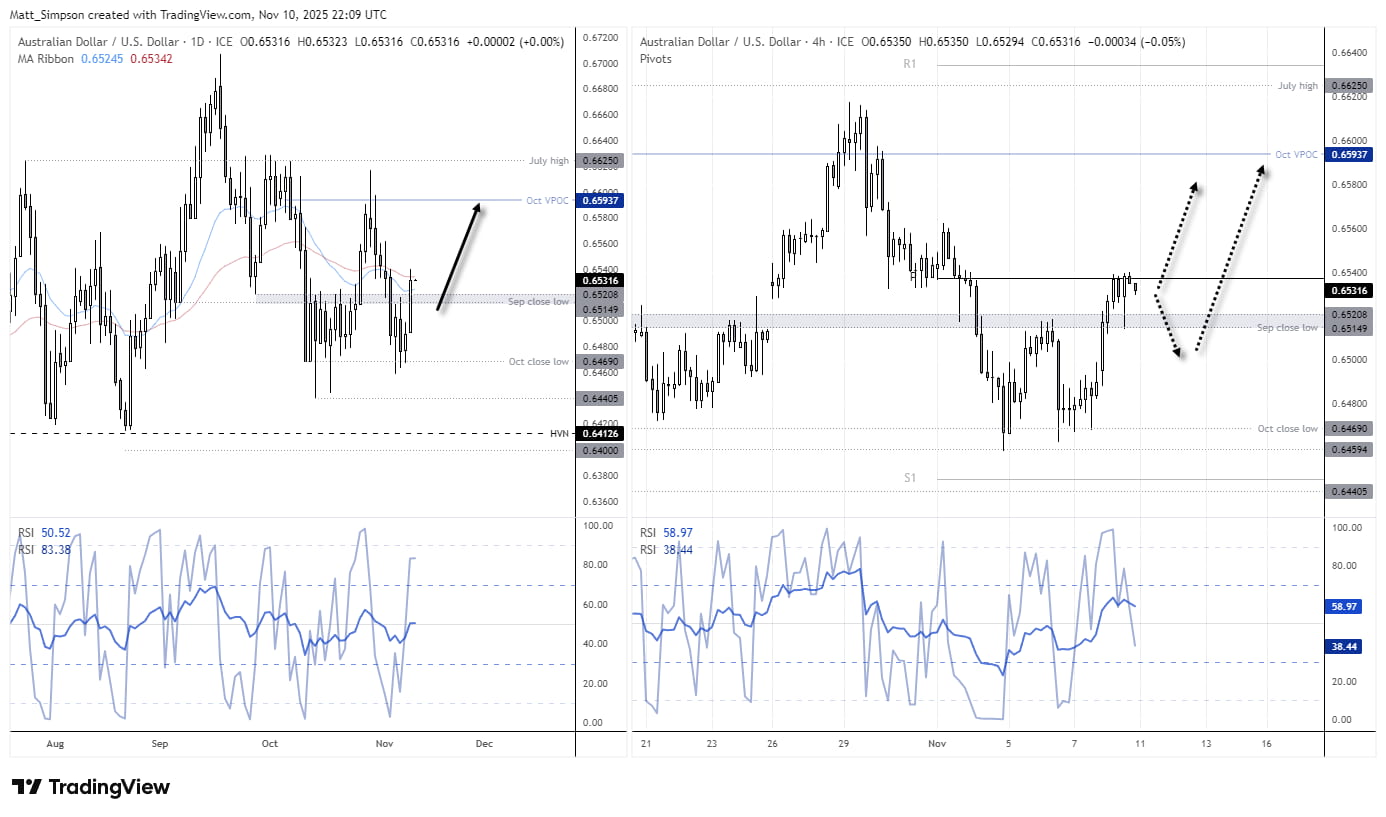
Chart analysis by Matt Simpson - source: LSEG

EUR/AUD Technical Analysis: Euro vs Australian Dollar
Last week, I outlined a bullish scenario for EUR/AUD on the daily chart after it printed an elongated bullish range expansion candle above key support levels. Previously, this pattern had seen the cross rise toward the top of its range, though Monday’s price action reversed the tables somewhat.
Friday’s shooting star candle produced a false break above the 100-day EMA, hinting at a swing high around the midpoint of the established sideways range. The daily RSI (2) also confirmed overbought conditions before Monday’s reversal lower. A three-candle bearish formation — an evening star reversal — has now completed.
Given the renewed appetite for risk, which typically favours the Australian dollar over the euro, a retest of the range lows around 1.7590 appears likely. A break beneath this level would suggest a broader topping pattern is in play and could pave the way for a move toward the May low near the 1.72 handle.

Chart analysis by Matt Simpson - data source: TradingView EUR/AUD
This image will only appear on cityindex websites!

GBP/AUD Technical Analysis: British Pound vs Australian Dollar
The British pound has remained in a well-defined downtrend against the Australian dollar since the April high. A spinning top doji formed on Friday near the 20-day EMA, and Monday’s bearish candle confirmed it as a lower high.
While GBP/AUD has found interim support around the February high, a retest and potential break below the 2.00 handle remain the favoured scenario given the prevailing bearish structure. The February Volume Point of Control (VPOC) at 1.9794 becomes the next downside target if price action extends beneath 2.00.
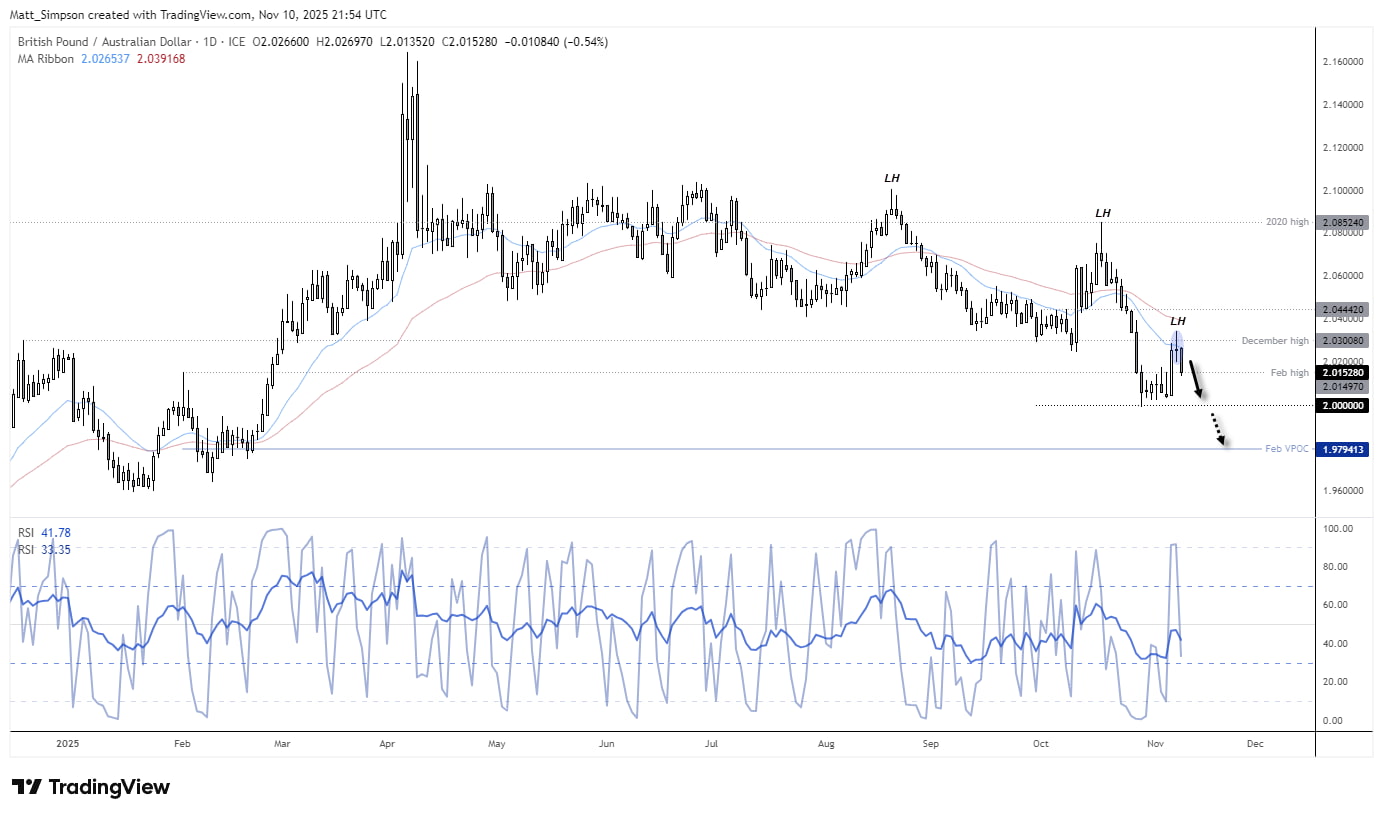
Chart analysis by Matt Simpson - data source: TradingView GBP/AUD
View the full economic calendar
-- Written by Matt Simpson
Follow Matt on Twitter @cLeverEdge
How to trade with City Index
You can trade with City Index by following these four easy steps:
- Open an account, or log in if you’re already a customer
• Open an account in the UK
• Open an account in Australia
• Open an account in Singapore
- Search for the market you want to trade in our award-winning platform
- Choose your position and size, and your stop and limit levels
- Place the trade


