


The Australian dollar was the strongest FX major on Wednesday as global markets swung sharply back into risk-on mode. Equities rebounded aggressively, volatility spiked, and safe-haven demand unwound after President Trump signalled progress on a NATO “framework” that appears to avoid fresh tariff threats linked to Greenland.
Details were limited — as is typical with Trump-led negotiations — but that didn’t stop markets reacting. The Nasdaq 100 jumped 1.5%, the Dow Jones rose 1.3%, and the S&P 500 clawed back most of Tuesday’s losses ahead of Trump’s Davos speech. In Asia, Nikkei futures surged 2% and SPI 200 (ASX 200) futures gained 0.5%, while gold printed fresh record highs.
View related analysis:
- Gold Bid at Highs as Trump Forces Tariff Debate Onto Davos’ Sidelines
- US Dollar Slips on Trump Tariffs: EUR/USD, USD/JPY Price Action Setups
- USD/JPY, EUR/USD, USD/CHF: FX Futures Positioning | COT Report
- ASX 200 Market Outlook: CBA Eyes 150 Break, RIO Signals Reversal Risk
Source: LSEG
Australian Dollar Surges as Tariff Risks Fade and Risk Appetite Returns
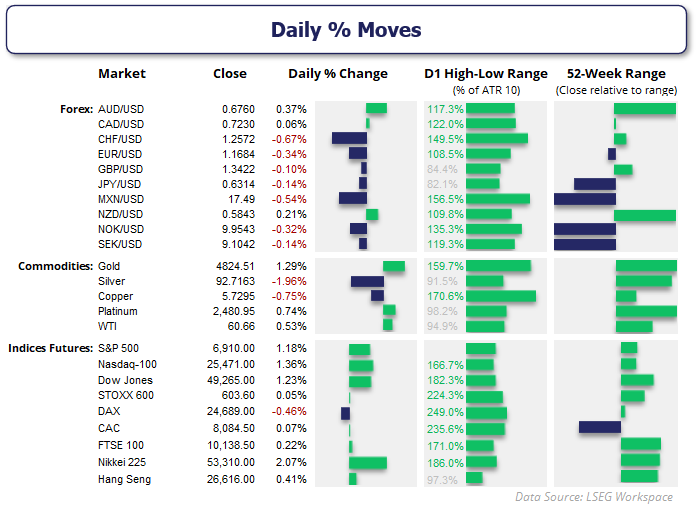
Most major markets tracked in the dashboards exceeded their 10-day ATR, with European indices more than doubling their usual average true range as traders priced out near-term tariff risk. The absence of fresh trade threats triggered a rapid unwind in defensive positioning, lifting higher-beta currencies and pressuring traditional safe havens.
Australian Dollar Rallies Broadly Across FX Crosses
- The Australian dollar gained the most ground against the euro, with the removal of tariff risk easing pressure on the ECB to hike rates and sending EUR/AUD to its lowest level since May.
- The risk-on tone reversed demand for the Swiss franc, helping AUD/CHF form a solid bullish engulfing day and putting it on the cusp of an eight-month high.
- The British pound also succumbed to Aussie strength, with GBP/AUD accelerating lower through 2.0 to hit an 11-month low.
- The Aussie even managed to outperform the New Zealand dollar for a day, although the bullish inside day on AUD/NZD stops short of confirming a cycle low and remains vulnerable to further losses.
- AUD/CAD rose 0.5% to a 15-month high, trading just 0.2% below its 2024 peak.
- The Japanese yen was also weaker, allowing AUD/JPY to extend its textbook bullish rally to an 18-month high and close above 107.
- AUD/USD rose for a third consecutive session, closing near its highest levels since October 2024.
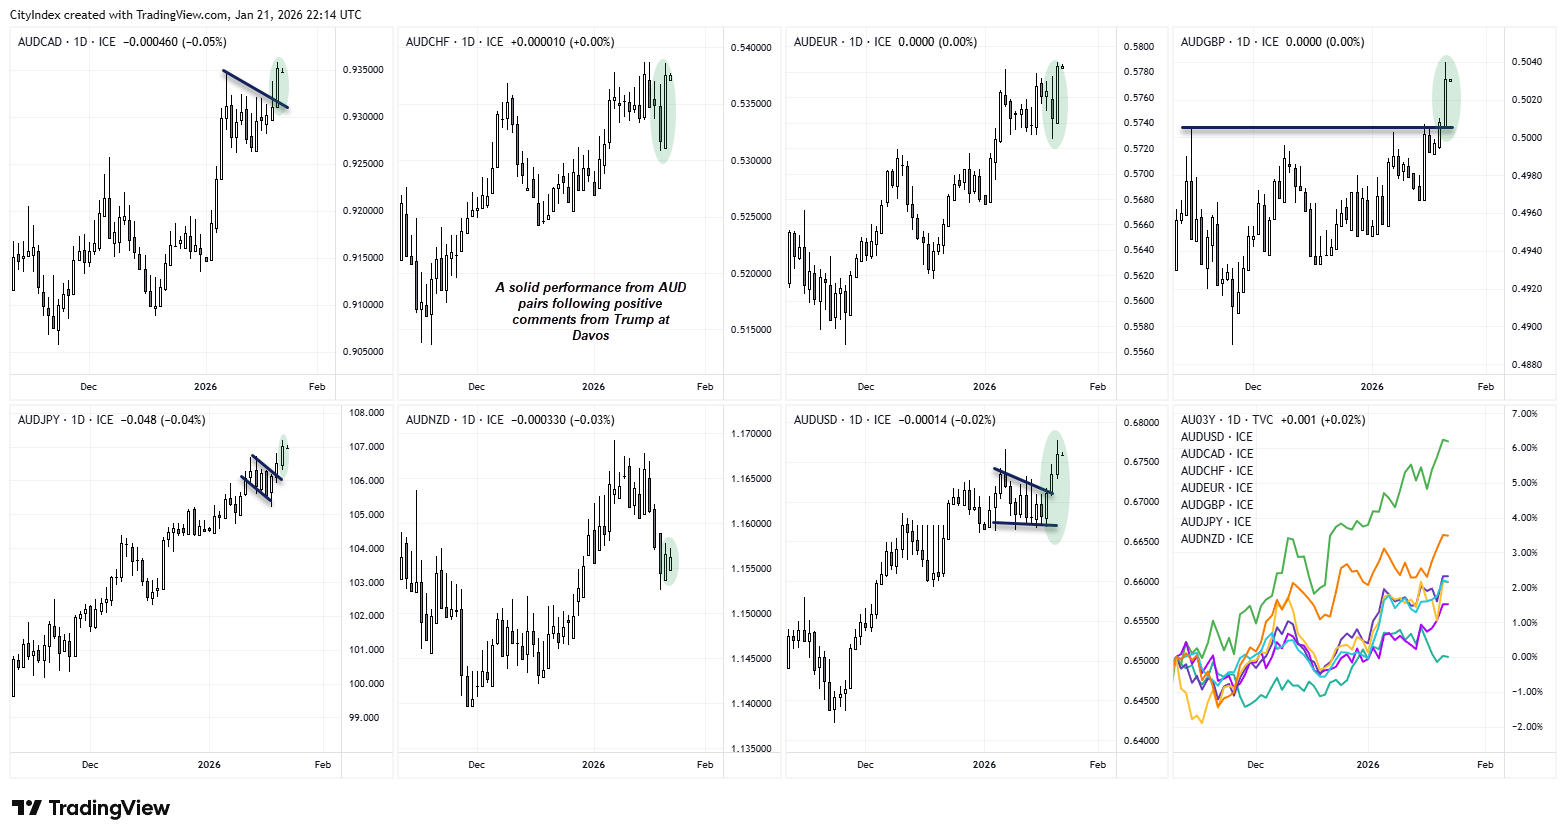
Source: TradingView
AUD/USD Options Signal Caution Beneath the Rally
While the Australian dollar benefited from the broader risk-on tone, options markets remain unconvinced. The rise in the 1-week 10-delta risk reversal alongside Wednesday’s AUD/USD rally reflects a reassessment of upside tail risk rather than a shift in the base-case outlook. In contrast, the 1-week 25-delta risk reversal edged lower, signalling traders remain sceptical of the rebound and continue to price downside or range risk as the most likely near-term outcome.
The 1-month 25-delta risk reversal was marginally higher, pointing to slightly improved medium-term sentiment, but not enough to confirm a sustained bullish regime.

Source: LSEG
Australian Employment Data in Focus Ahead of Key CPI Test
Attention now shifts to Australia’s employment report, where December figures will be revealed. Keep in mind the data is vulnerable to seasonal noise and may appear stronger than underlying trends suggest. That said, it likely won’t stop algos from responding positively and potentially bidding AUD/USD if the numbers add further pressure to RBA hike expectations. Still, this is little more than a warm-up for next week’s quarterly CPI figures, which could single-handedly determine whether the RBA hikes at its February meeting or not.

AUD/USD Technical Analysis: Australian Dollar vs US Dollar
The Aussie is on track for its best week since April and sits comfortably above 67c ahead of today’s employment figures. Bulls appear to have 68c in their sights next, although an average or slightly underwhelming jobs report could allow for a pause or minor pullback before the next leg higher.
The daily chart shows AUD/USD trading just above its monthly R1 and weekly R2 pivots, suggesting a modest pullback may be due unless risk appetite deteriorates further. A break above 0.68 would bring the monthly R2 pivot at 0.6832 and the historical weekly VPOC at 0.6844 into focus, just below the 0.6850 level.
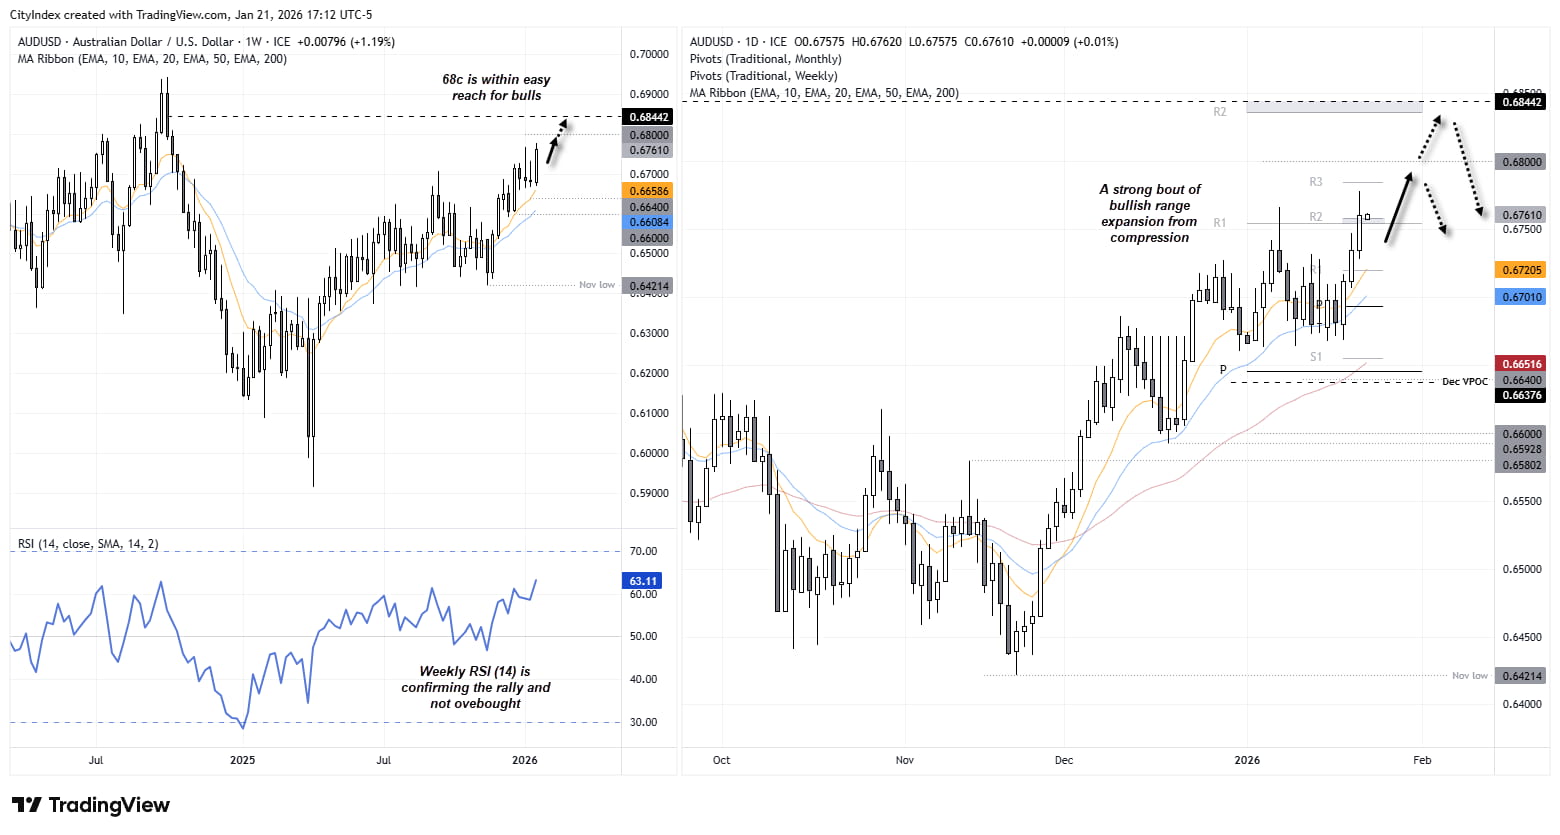
Source: TradingView
View the full economic calendar
-- Written by Matt Simpson
Follow Matt on Twitter @cLeverEdge
How to trade with City Index
You can trade with City Index by following these four easy steps:
- Open an account, or log in if you’re already a customer
• Open an account in the UK
• Open an account in Australia
• Open an account in Singapore
- Search for the market you want to trade in our award-winning platform
- Choose your position and size, and your stop and limit levels
- Place the trade


