The US and Iran agreed to a temporary, conditional ceasefire on Tuesday, prompting the Australian dollar to lead the risk-on rally for FX on what is now dubbed Trumps’ Taco Tuesday.
Appetite for risk is on a tear following President Trump’s decision to delay the bombing of Iran by two weeks, allowing more time for talks. Although Iran’s public endorsement of a ceasefire is arguably the bigger headline, given they had consistently pushed back on Trump’s claims that talks were even happening — let alone progressing well.
View related analysis:
- USD/JPY Outlook: US Dollar Stalls at 160 as Nikkei Eyes Gains
- AUD/USD Outlook: Trump Address Could Trigger Breakout or Breakdown
- AUD/USD Outlook 2026: Key Drivers for the Australian Dollar in Q2
- Australian Dollar Outlook: Geopolitics and US Data to Drive AUD/USD Volatility
When you factor in that the two-week delay is longer than the original 10-day window set for the initial attack, it seems plausible that the worst of the conflict may now be behind us. It’s now down to negotiators to reopen the Strait of Hormuz, though at what cost remains to be seen.
Naturally, we can expect President Trump to claim victory and regime change, while overlooking the fact that the same regime remains in power. Iran has also demonstrated its ability to hold global oil markets hostage via the Strait of Hormuz. The true knock-on effects of this conflict may therefore take time to play out, as it seems unlikely Iran will loosen its grip on the Strait anytime soon.
Markets can worry about the complexities later — for now, they’ve been given the green light to rally.

Australian Dollar Rallies as Iran Ceasefire Sparks Risk Appetite
The Australian dollar is the clear leader for FX amid today’s risk-on rally
- AUD/USD rose as much as 1.7% after the Iran headlines dropped, and currently on track for its most bullish day in three months
- AUD/CAD tapped 0.98 and reached a 5-year, 2-month high
- AUD/NZD has risen to a 3-year high ahead of today’s RBNZ decision
- AUD/JPY is up for a third day with bulls probing 1.12, as safe-haven flows move away from safe haven
- AUD/CHF is currently up 1.3% on the week, potentially marking its best week since December
- AUD/EUR is up for a sixth day – its best such run since June – amid its best day in 20
- AUD/GBP up for a fifth day and at a 13-day high
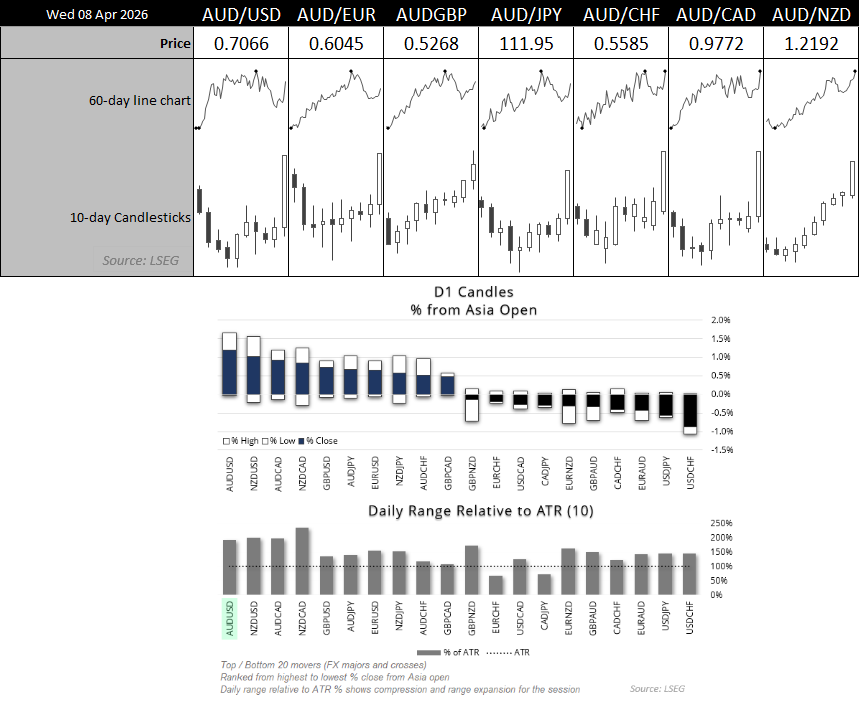
Source: LSEG
AUD/USD Technical Analysis: Australian Dollar vs US Dollar
While I had flagged the potential for a pullback on AUD/USD in recent weeks due to stretched bullish exposure in the Australian dollar futures market, it is possible we may have already seen the end of that correction.
Assuming the Strait of Hormuz is reopened within two weeks, it would allow traders to refocus on domestic data — which tends to support the case for further RBA hikes.
AUD/USD Futures Positioning | COT Report
- Gross longs reached a 10-year high among large speculators last week
- Net-long exposure remained near record highs
- Gross short exposure fell to its lowest level since November 2024 among large speculators, and to a 10-month low among asset managers
The fact that short bets never rose during this retracement suggested the pullback could be limited — unless the situation in the Middle East materially deteriorated.
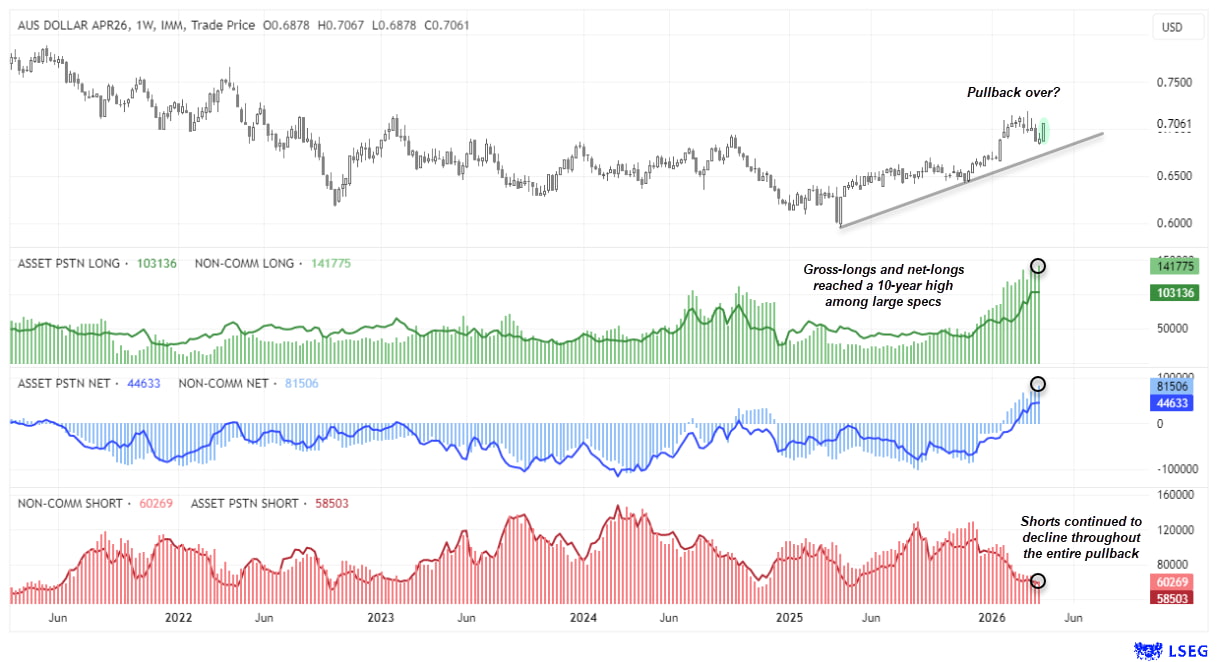
Source: LSEG

AUD/USD Regains Bullish Momentum Above 70c
Zooming in, we can see that the AUD/USD weekly chart (left) is on track to form a three-week bullish pattern known as a morning star reversal. Note that last week’s doji low respected the 20-week EMA, and prices are now back within the 8-week range where they were contained between the 2023 and 2024 highs. Implied volatility has also fallen by around 50%, although it remains elevated compared to the start of the year.
Risk Reversals Turn Less Bearish for AUD/USD
The daily chart shows that risk reversals bottomed around one month ago. While they remain negative — indicating options traders still favour downside protection over bullish bets — the fact that put demand is diminishing can be seen as a relatively bullish signal.
Bullish momentum has also picked up on the daily chart, with AUD/USD comfortably back above 70c. Unless we see the ceasefire unravel, my bias is for bulls to buy dips in anticipation of a breakout above the 2023 high. This scenario likely requires the ceasefire to hold and the Strait of Hormuz to reopen, regardless of who ultimately controls it once talks are finalised.
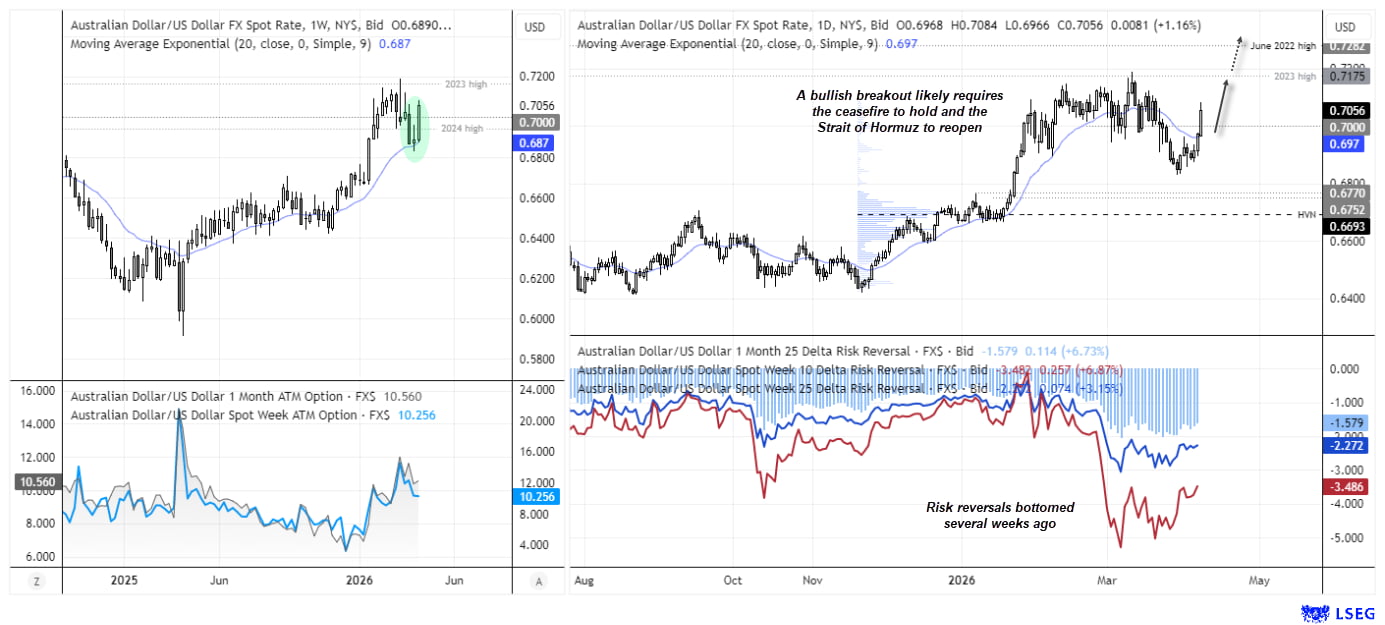
Source: LSEG