


Australian Dollar Crosses Weekly Outlook: AUD/NZD, AUD/CAD, EUR/AUD
With the Reserve Bank of Australia (RBA) slowly tilting towards a more dovish stance, the Australian dollar is facing further pressure against some of its commodity-FX peers, notably the New Zealand and Canadian dollars. Today’s New Zealand producer prices and Canadian inflation data could influence AUD/NZD and AUD/CAD, and in both cases, my bias is for these crosses to move lower once any initial bounces have played out. EUR/AUD also shows scope to extend higher, even if its inverted head and shoulders pattern becomes invalidated in the near term.
View related analysis:
- AUD/USD Weekly Outlook: Jackson Hole, RBNZ Key for Australian Dollar
- USD/CAD Technical Outlook: Futures Traders move Against the Canadian Dollar
- AUD/USD Softens, ASX Hits Record as RBA Cuts and Lowers Cash Rate Projection
AUD/CAD Technical Analysis: Australian Dollar vs Canadian Dollar
- AUD/CAD rejected at 0.90 with multiple bearish engulfing candles, signalling momentum is shifting lower.
- Canadian dollar strength possible if hot inflation data reduces chances of further Bank of Canada rate cuts.
- Downside bias favours 0.89 with 200-day SMA/EMA at 0.8954 offering minor support before another potential leg lower.
Price action on the daily chart has been choppy for AUD/CAD since mid-April, with its sideways range offering swing traders several opportunities. More recently, the pair has struggled to sustain moves above 0.90, and momentum is now turning lower. The Canadian dollar could strengthen further against the Australian dollar this week if inflation data surprises to the upside or remains elevated, as this would dampen hopes of another Bank of Canada (BOC) rate cut any time soon.
Last week produced a bearish pinbar followed by a bearish engulfing (outside) day around the 0.90 handle. Another bearish engulfing candle formed on Monday and looks set to close at the day’s low. Bears may be eyeing a move towards 0.89, which coincides with a high-volume node within the broader range.
Resistance at 0.90 has repeatedly capped price action, with several false intraday breaks followed by renewed bearish momentum. This suggests the Australian dollar may be setting up for another leg lower against the Canadian dollar.
The 200-day SMA and EMA both sit near 0.8954, making this area an initial support zone. A brief bounce from yesterday’s low is possible, but while prices remain beneath Monday’s high, the bias favours further downside — potentially increasing the reward-to-risk ratio for bearish setups.
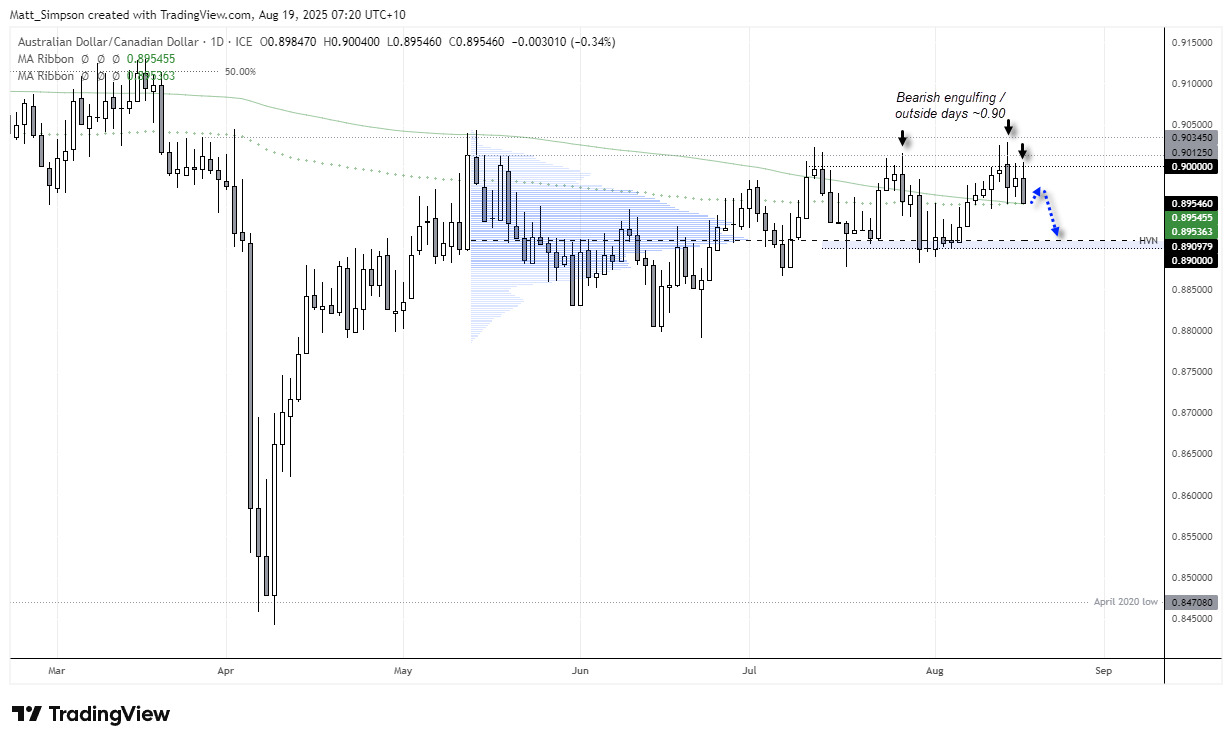
Chart analysis by Matt Simpson - data source: TradingView AUD/CAD
AUD/NZD Technical Analysis: Australian Dollar vs New Zealand Dollar
- Weekly momentum fading below 1.10 after a strong April rally, signalling potential retracement.
- Daily chart shows rejection at 61.8% Fibonacci with momentum turning lower, 200-day SMA as near-term support.
- A bounce into 200-day SMA may be sold into, with a break beneath targeting the August low.
AUD/NZD is flashing mixed technical signals, creating potential setups for both bulls and bears.
On the weekly chart, momentum from the April rally is fading as the pair approaches the 1.10 handle. Price action hints at a possible retracement lower, though another marginal high cannot be ruled out before a pullback develops.
On the daily chart, bulls are struggling to push AUD/NZD through the 61.8% Fibonacci retracement, with momentum turning lower at the start of the week. The nearby 200-day SMA could attract dip-buyers, but the broader bias remains cautious below 1.10.
If AUD/NZD bounces from the 200-day SMA, bears may see opportunities to fade rallies, with a decisive break beneath the 200-day SMA opening the door to a retest of the August low.

Chart analysis by Matt Simpson - data source: TradingView AUD/NZD
EUR/AUD Technical Analysis: Euro vs Australian Dollar
This is a quick follow-up to last week’s EUR/AUD outlook. The euro has broken higher against the Australian dollar on the daily chart, in line with the inverted head and shoulders pattern. The initial target was the swing highs near 1.0894, though momentum has already stalled just below the 1.096 handle.
Technically, the head and shoulders setup is close to being invalidated. However, if prices break beneath Monday’s low, euro bulls may still look for signs of a higher low while EUR/AUD holds above 1.078. Such price action would keep the broader bullish trend intact and maintain the potential for continuation towards the 1.81 level – whether or not the H&S pattern remains valid.

Chart analysis by Matt Simpson - data source: TradingView EUR/AUD
Key Economic Events for Traders (AEST / GMT+10)
08:45 NZD PPI Input, PPI Output (NZD/USD, AUD/NZD, NZD/JPY)
10:30 AUD Westpac Consumer Sentiment (AUD/USD, AUD/JPY, EUR/AUD)
11:30 AUD MI Inflation Expectations (AUD/USD, AUD/JPY, EUR/AUD)
18:00 EUR Current Account, Current Account n.s.a. (EUR/USD, EUR/GBP, DAX)
18:30 HKD Unemployment Rate (USD/HKD, EUR/HKD, AUD/HKD)
19:30 EUR German 5-Year Bobl Auction (EUR/USD, EUR/GBP, DAX)
22:30 USD Building Permits, Housing Starts (S&P 500, Nasdaq 100, USD/JPY)
22:30 CAD Common CPI, Core CPI, CPI, Median CPI, Trimmed CPI (USD/CAD, EUR/CAD, CAD/JPY)
22:55 USD Redbook (S&P 500, Nasdaq 100, USD/JPY)
01:00 NZD GlobalDairyTrade Price Index (NZD/USD, AUD/NZD, NZD/JPY)
01:00 USD Milk Auctions (S&P 500, Nasdaq 100, USD/JPY)
01:30 USD Atlanta Fed GDPNow (S&P 500, Nasdaq 100, USD/JPY)
04:10 USD FOMC Member Bowman Speaks (S&P 500, Nasdaq 100, USD/JPY)
06:30 USD API Weekly Crude Oil Stock (WTI Crude, Brent Crude, USD/CAD)
View the full economic calendar
-- Written by Matt Simpson
Follow Matt on Twitter @cLeverEdge
How to trade with City Index
You can trade with City Index by following these four easy steps:
- Open an account, or log in if you’re already a customer
• Open an account in the UK
• Open an account in Australia
• Open an account in Singapore
- Search for the market you want to trade in our award-winning platform
- Choose your position and size, and your stop and limit levels
- Place the trade


