
Bitcoin futures remain under pressure following a steep two-week sell-off from record highs. Yet, despite growing bearish positioning, the market continues to hold key technical levels near the 200-day EMA — setting up a potential battleground between bears seeking continuation and those wary of a short squeeze.
View related analysis:
- Bitcoin, S&P 500 Outlook: Wall Street Volatility Rattles BTC
- Gold Suffers Fifth Worst-Day Drop in 55yrs As Momentum Trade Unwinds
- With US Dollar ‘Rebound’ Waning, EUR/USD and GBP/USD Could Bounce
Bitcoin Futures Analysis: Bears Risk Short Squeeze as Downtrend Momentum Slows
Bitcoin’s Triple Top Signals Potential for Deeper Correction
A couple of weeks ago, I noted the triple top on the Bitcoin futures weekly chart. When combined with steadily declining volume and a multi-month bearish RSI divergence, it reeks of a market top. And when we consider that it has only fallen 18% over the past two weeks—compared with the two prior corrections of around 32%—I suspect Bitcoin could at least retest 100k and possibly retrace deeper.
It’s also worth noting that Bitcoin has just suffered its worst two-week period in 13 months. While the two-week decline in September 2024 marked a cycle low, the fact that we’ve now seen a sharp reversal of sentiment at a record high leans more towards its cycle higher than the beginning.
However, before we get too bearish too soon, bears must first conquer a key support zone between the 100k handle and the June low (102,145). Perhaps the support zone could mark the end of the initial wave lower in an ABC correction, prompting a bounce higher before an eventual break lower. For comparison, a 32% decline from the record high — similar to the two prior corrections — would project to just below 89,000.
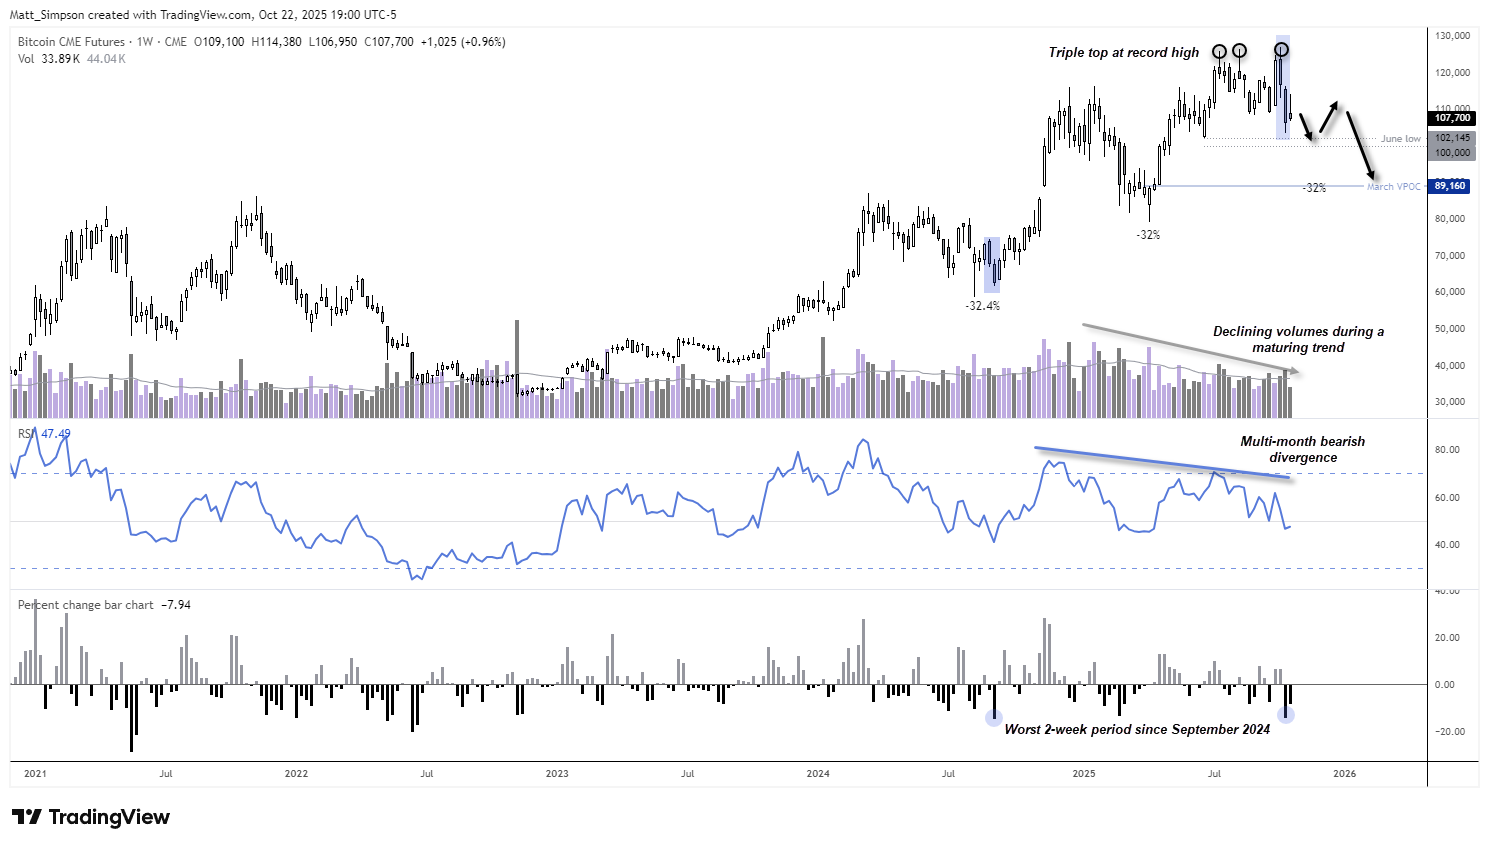
Chart analysis by Matt Simpson - data source: TradingView Bitcoin CME Futures (BTC1!)
Bitcoin Futures Daily Chart: Bears Press Shorts, Though Short-Squeeze Risk Builds
The daily timeframe shows that the sharp drop from Bitcoin’s all-time high (ATH) occurred in a single, straight line. Momentum has also realigned with that bearish move following a two-day bounce, with a three-bar bearish reversal (evening star pattern) likely appealing further to bears. Moreover, cumulative volume delta (CVD) has continued to trend lower ahead of prices, indicating that offers (sell orders) continue to outnumber bids (buy orders).
Bears are essentially front-running an anticipated leg lower. However, the longer Bitcoin prices refrain from breaking last week’s swing low, the more nervous these pre-emptive bears may become—potentially prompting some to cover their shorts and inadvertently lift prices higher. It’s also worth noting that prices are currently holding above the 200-day EMA.

Ultimately, prices need to move lower quickly to avoid a short-covering rally. And with the 200-day EMA in play, there’s potential for a higher low to form over the near term. Bears may therefore wish to wait for a break of the 200-day EMA or seek evidence of a lower high (swing high) following a bounce from current levels before initiating new short positions.
Either way, my bias remains for a retest of 100k, near the 98,690 high-volume node (HVN). A break beneath the 97,520 lows near the 61.8% Fibonacci level would assume a deeper correction, bringing 90k into focus near the March VPOC and the –32% retracement level from its record high.
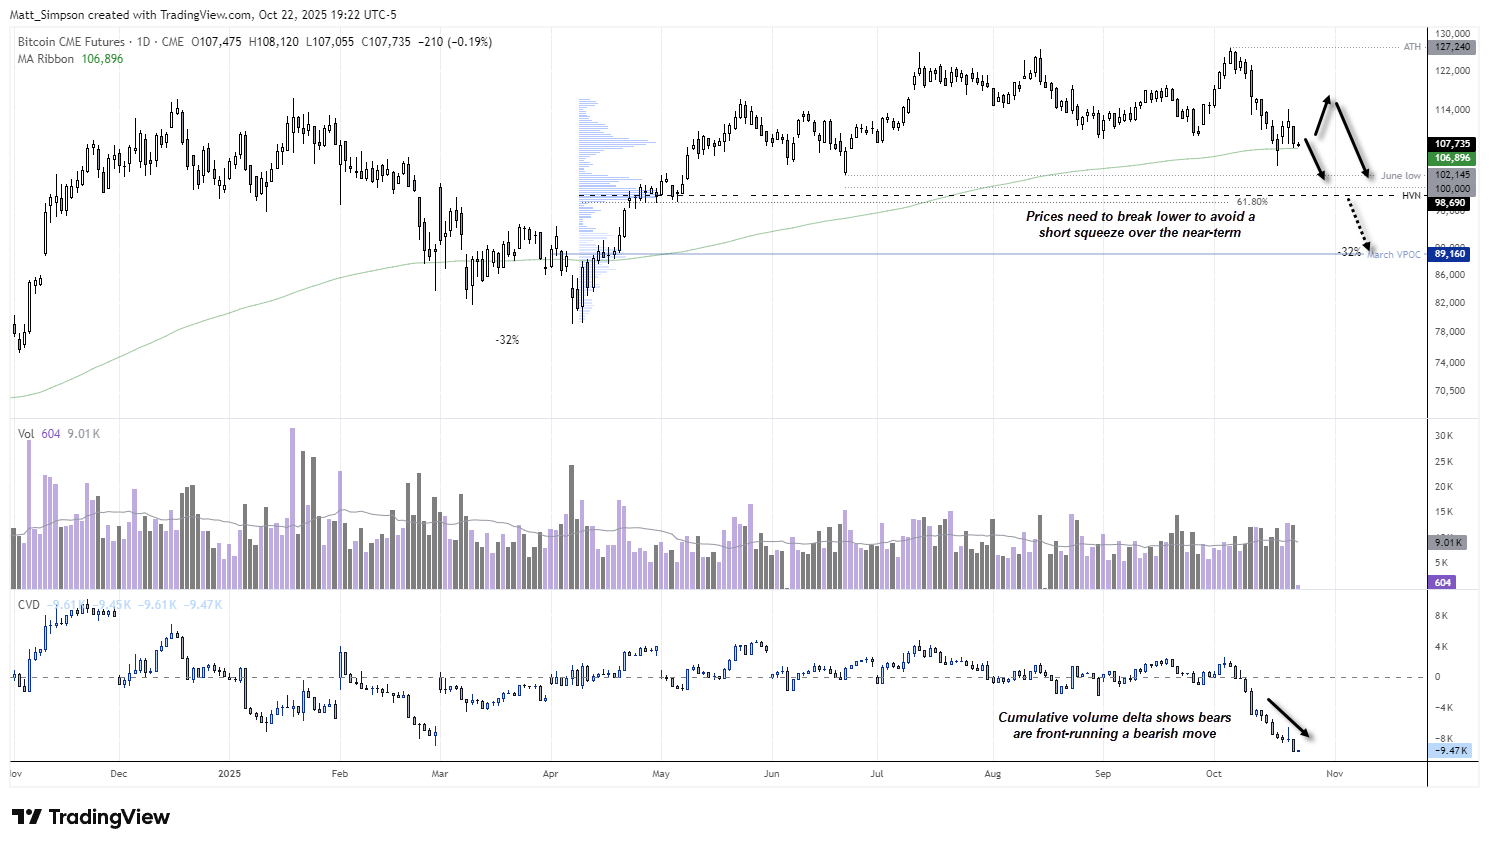
Chart analysis by Matt Simpson - data source: TradingView Bitcoin CME Futures (BTC1!)
View the full economic calendar
-- Written by Matt Simpson
Follow Matt on Twitter @cLeverEdge
How to trade with City Index
You can trade with City Index by following these four easy steps:
- Open an account, or log in if you’re already a customer
• Open an account in the UK
• Open an account in Australia
• Open an account in Singapore
- Search for the market you want to trade in our award-winning platform
- Choose your position and size, and your stop and limit levels
- Place the trade