


Bitcoin futures came within a cat’s whisker of the bullish flag target I outlined back in Q4 last year, with the recent record high briefly trading above $124,800 on July 14. That’s close enough for a cigar moment in my books. With sentiment on Wall Street buoyant, trade tensions seemingly behind us, and a Trump administration finally turning its attention to crypto land, further upside for Bitcoin remains the core theme.
View related analysis:
- Bitcoin bulls stop to admire the view on their way to $100k
- The stats are working against bitcoin bulls today
- Bitcoins 100k speedbump prompts shakeout at the highs
- Bitcoin tops 80k as Republicans inch closer to a red wave
Bitcoin Futures Technical Outlook: Bull Flag Support Holds as Bulls Target 134,000
The daily chart shows a strong uptrend since the breakout in late April, with the cumulative volume delta (CVD) broadly confirming the move higher—indicating that buyers have remained the dominant force during the rally.
However, CVD has slipped in recent sessions while prices remain elevated, suggesting waning support in the near term. Traders may want to stay alert for a potential shakeout at current levels. That said, given the strength of the daily trend, bulls are likely to welcome any dips towards support as opportunities to re-enter in anticipation of a break to new highs.
• The January and 2024 highs around 115,000 could offer support for a shallow swing low—potentially forming a bull flag on the daily chart.
• A bull flag breakout from this pattern projects a potential target around 134,000, assuming prices hold above 115,000.
• A break below 115,000 shifts focus to the high-volume node (HVN) at 106,610, which could still offer a favourable area for bulls to rejoin the broader trend.
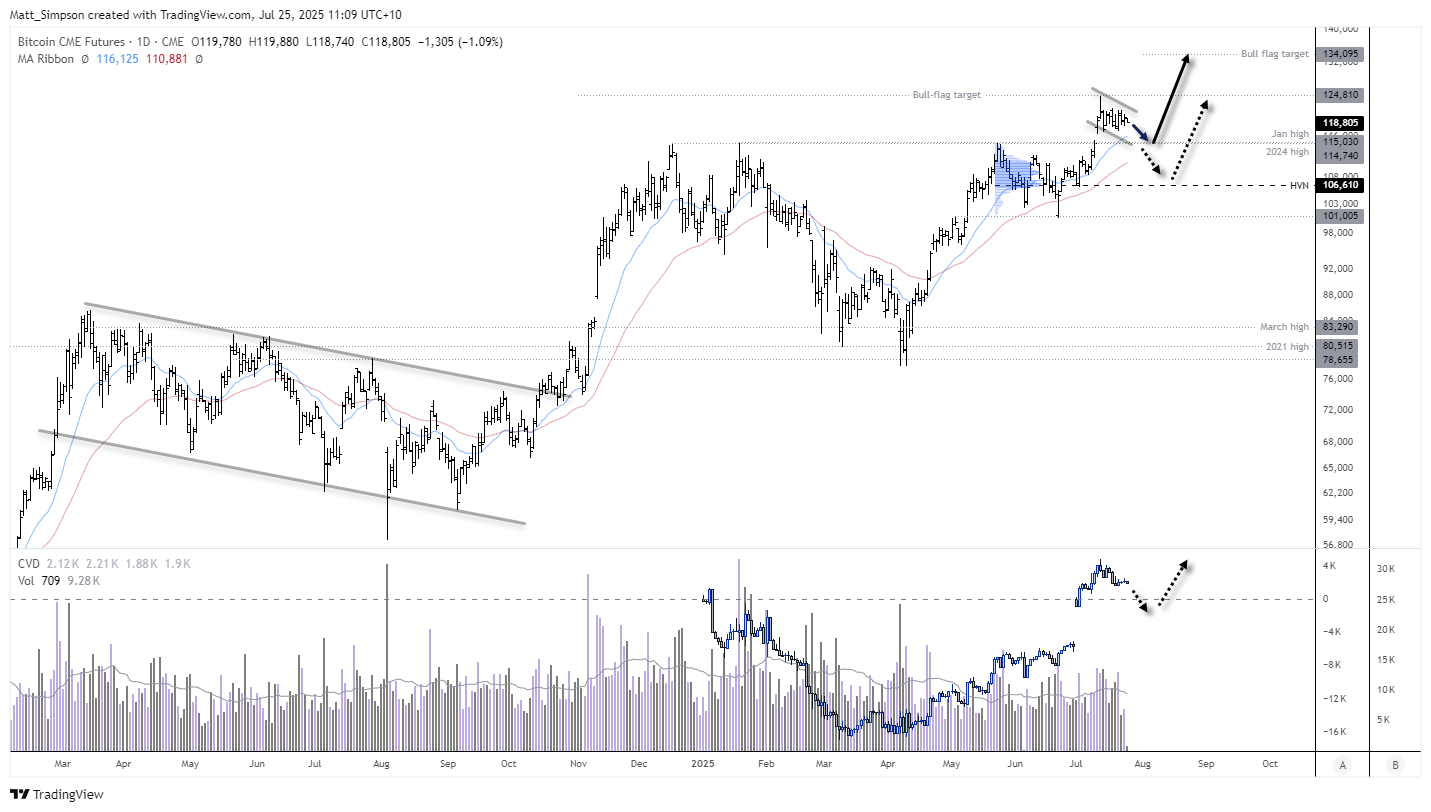
Chart analysis by Matt Simpson - Source: TradingView Bitcoin CME Futures (BTC1!)
Bitcoin Futures Leveraged Exposure – COT Report
Net-short exposure among leveraged traders reached a record high in December while Bitcoin prices were also at record levels—strongly implying that these traders were acting as hedgers. The decline in net-short exposure throughout 2025, even as prices continued to rise, suggests reduced hedging activity among leveraged participants.
Additionally, the rise in gross long positions since the April low—outpacing gross shorts—implies that leveraged traders may be shifting toward a more speculative, bullish stance rather than simply managing downside risk.

Chart analysis by Matt Simpson - Source: CME, LSEG
View the full economic calendar
-- Written by Matt Simpson
Follow Matt on Twitter @cLeverEdge
How to trade with City Index
You can trade with City Index by following these four easy steps:
- Open an account, or log in if you’re already a customer
• Open an account in the UK
• Open an account in Australia
• Open an account in Singapore
- Search for the market you want to trade in our award-winning platform
- Choose your position and size, and your stop and limit levels
- Place the trade


