
- Bitcoin outlook: Consolidation continues around $69,000–$70,000 key area
- Oil prices and Middle East conflict haven’t had major bearish impact on BTC
- Breakout above $75,000 needed to confirm bullish momentum
I think Bitcoin is in the process of caving out a bottom after ending its 5-month losing streak in March around a major technical level. Let’s break it down in this in-depth technical analysis of the cryptocurrency.
Bitcoin outlook: coiling ahead of a potential breakout
The technical outlook on Bitcoin could turn more positive after months of bearish price action. For now, it remains in a consolidation phase following the second wave of sharp corrective move seen from mid-January into early February. Since that decline, price action has stabilised, with Bitcoin repeatedly rotating around the $69,000 to $70,000 region.
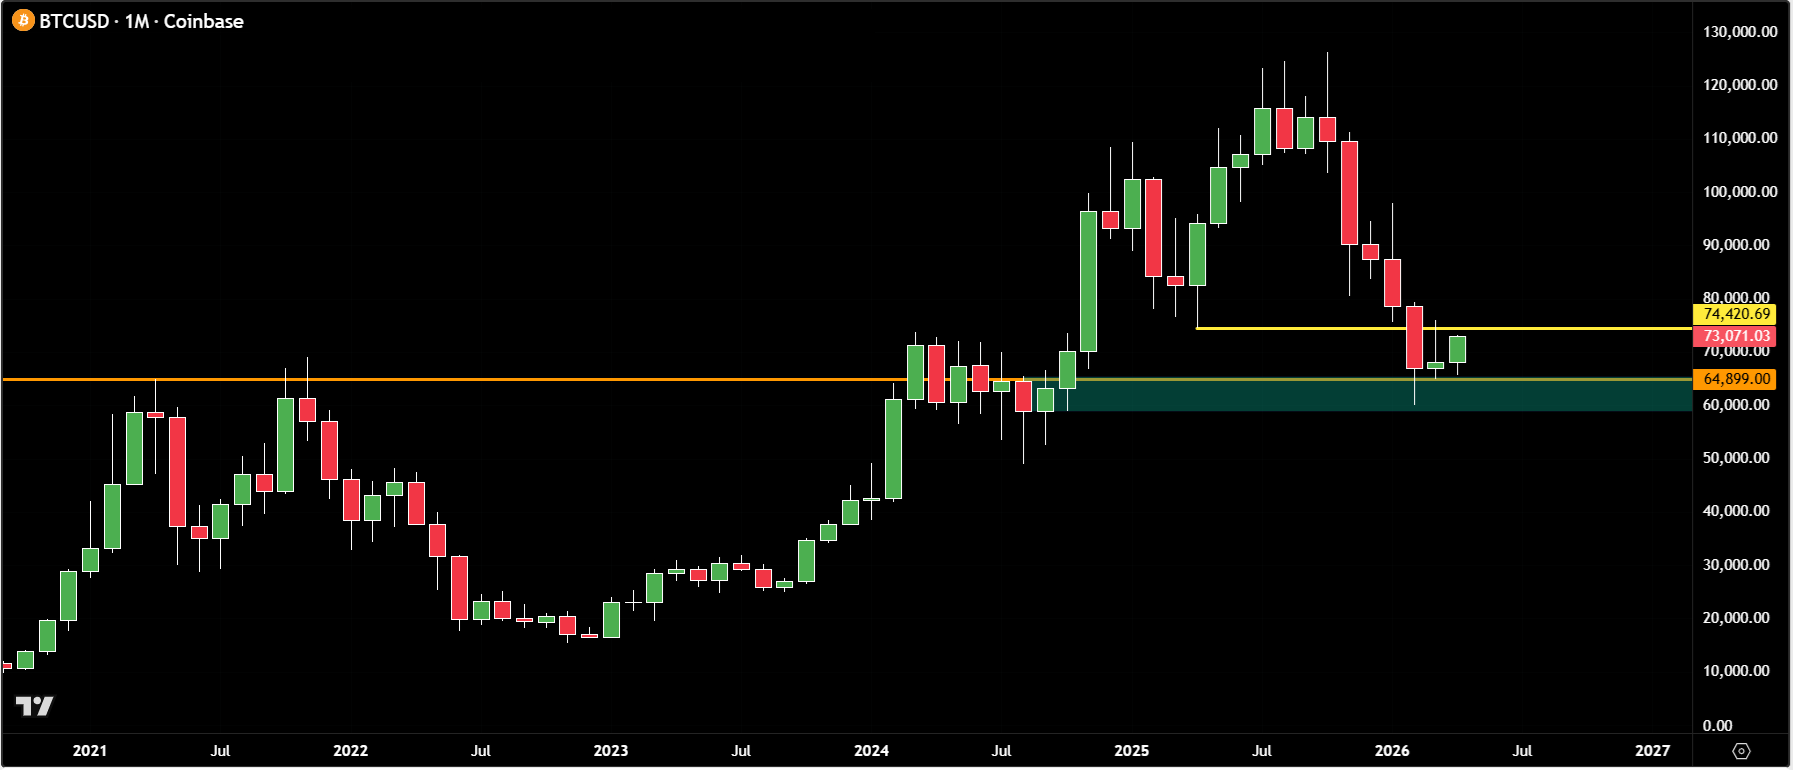
From a technical point of view, this zone is important. It previously acted as resistance during the prior advance and is now attempting to function as support. The fact that Bitcoin has repeatedly defended this area suggests the market is trying to build a base, although conviction remains limited.
What is still missing in the current structure is strong follow-through momentum. Each recovery attempt so far has lacked the impulsive buying needed to confirm a sustainable trend reversal. As a result, the Bitcoin outlook remains neutral-to-cautiously constructive rather than decisively bullish.
That said, the broader context is not entirely negative. The consolidation itself follows an extended period of downside pressure, and typically, markets often need time to reset before attempting a new trend. If macro risk sentiment improves—particularly through easing geopolitical tensions —the probability of an upside resolution increases.
Key levels to watch
On the upside, immediate resistance is firmly established between $73,000 and $76,000. This zone previously acted as a major support area before being broken earlier in the year, and since then it has repeatedly rejected upside attempts. Markets often retest broken support levels as resistance, and that is exactly what we are seeing here.
Adding further weight to this ceiling is a descending trendline connecting the October 2025 high with the mid-January 2026 peak. This trendline currently intersects around $74,000, reinforcing the importance of this region.
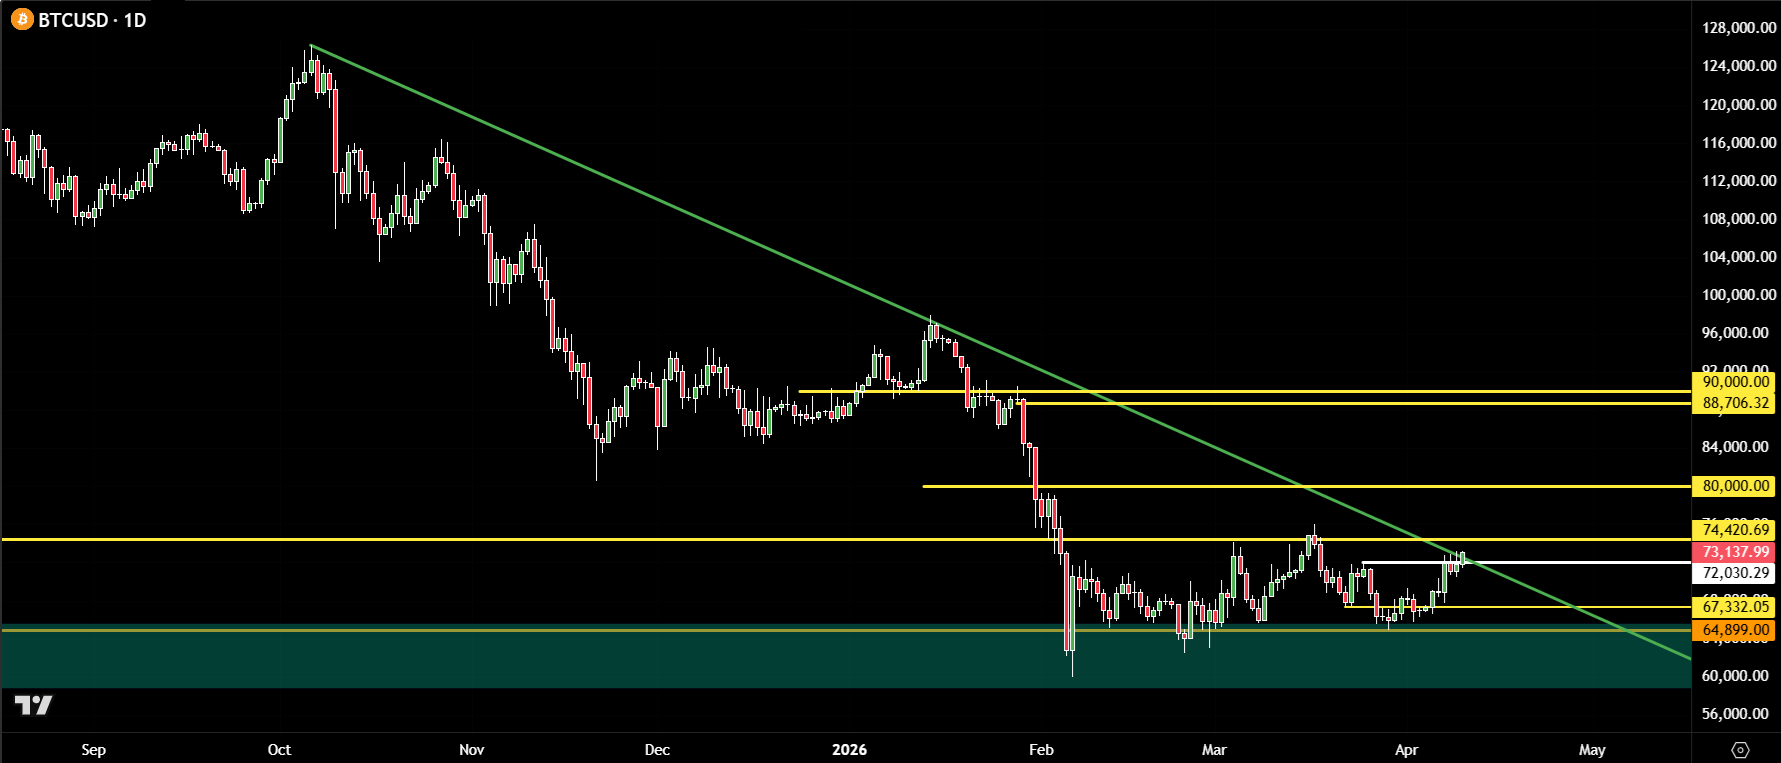
A decisive breakout above $73,000–$75,000 on the Bitcoin chart would be a key technical development. It would signal that sellers are finally losing control of this supply zone and would significantly improve the Bitcoin outlook in the short term.
If that breakout occurs with momentum, the next upside objective would be $85,000, followed by a more structural target near the 200-day moving average around $88,000. Notably, this area also aligns with the breakdown region from late January, making it a major battleground for price action.
Downside risks still need to be monitored
Despite the potential for recovery, downside risks remain firmly in play. The $69-$70K level is the key short-term pivot. A sustained break below this area would weaken the developing base and shift momentum back in favour of sellers. Recent support around $65K needs to hold and is the line in the sand for me. However, if that level were to give way, the Bitcoin outlook would likely deteriorate further, with price potentially rotating back towards the range lows around $60,000.
Final thoughts on BTC/USD forecast
Bitcoin is sitting at a critical inflection point. The market is coiling between well-defined support at $69,000 and strong resistance at $73,000–$75,000. A breakout on either side is likely to define the next medium-term trend. Until then, Bitcoin outlook is only modestly bullish at this stage, as it remains in a consolidation phase where patience and confirmation are required.

-- Written by Fawad Razaqzada, Market Analyst
Follow Fawad on Twitter @Trader_F_R
How to trade with City Index
You can trade with City Index by following these four easy steps:
- Open an account, or log in if you’re already a customer
• Open an account in the UK
• Open an account in Australia
• Open an account in Singapore
- Search for the company you want to trade in our award-winning platform
- Choose your position and size, and your stop and limit levels
- Place the trade