


With bitcoin futures falling 53.5% in just 17 weeks, it is safe to say bears have been in charge. While this likely points to further losses in the months ahead, we may be approaching a near-term inflection point that could favour bulls.
View related analysis:
- Bitcoin (BTC) Bulls Regain Control as 100k and 110k Come Into View
- Bitcoin Rout Stalls as Familiar Retracement Pattern Reappears
- Bitcoin, S&P 500 Outlook: Wall Street Volatility Rattles BTC
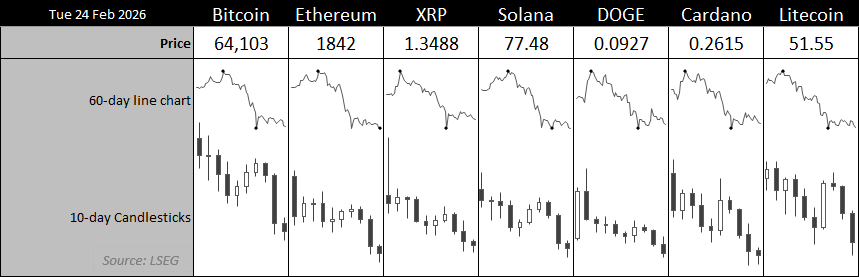
Source: LSEG
Bitcoin (BTC/USD) Technical Analysis: Bitcoin vs US Dollar
Bitcoin Futures Weekly Chart: 60k Support in Focus
The weekly chart shows that bitcoin futures slid 53.5% from the October high to just shy of 60k in only 17 weeks. Naturally, this has pushed the RSI into oversold territory, although it is not always the best timing tool for a reversal. Still, there are clues that bitcoin could hold above 60k for the foreseeable future — even if an eventual break beneath it remains on the table as prices eye 50k or the high-volume node (HVN) at 47,145.
The recent swing low has an elongated lower wick, which stalled a cats whisker above 60k before recouping around half of the week’s losses, and closing just below the 200-day week SMA. The two subsequent inside bars formed in the upper half of the elongated bearish candle, each with lower wicks to show bulls fighting back. While prices are trying to tease bears with a break below 65k, I suspect more bulls await closer to 60k and are quietly accumulating such dips.
- Bulls could consider dips towards 60k, targeting the 200-week SMA (70,802), 75k and 80k.
- The bias remains for prices to continue lower while they hold beneath 80k — a pivotal level on the weekly chart.
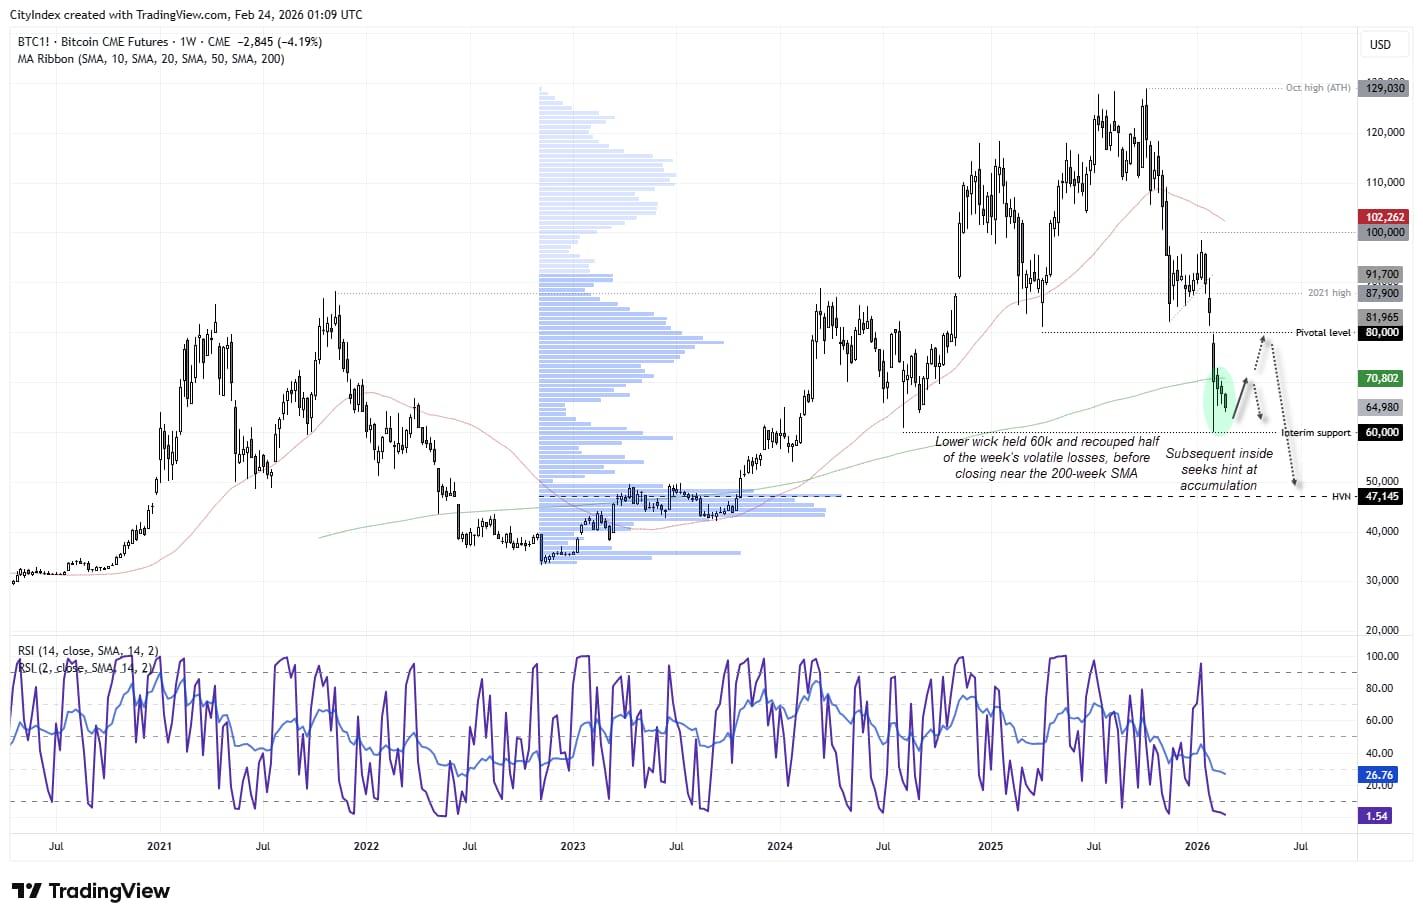
Source: CME, TradingView

Bitcoin Futures: Bears Press 60k After Triangle Breakdown
Risk-off trade saw prices break lower from a symmetrical triangle, with bitcoin futures now trading below 65k. Prices respected the 10-day EMA as resistance, and there was volume behind the move, suggesting bears want another crack at 60k. While the daily chart appears compelling for bears, I would urge caution given the significance of 60k as support — making it a pivotal level for traders to monitor this week.
For now, the bias remains for a bounce above 60k and for bears to reconsider shorts around resistance levels. A break below 60k, however, paves the way for a move towards 50k — regardless of whether a bounce materialises first.
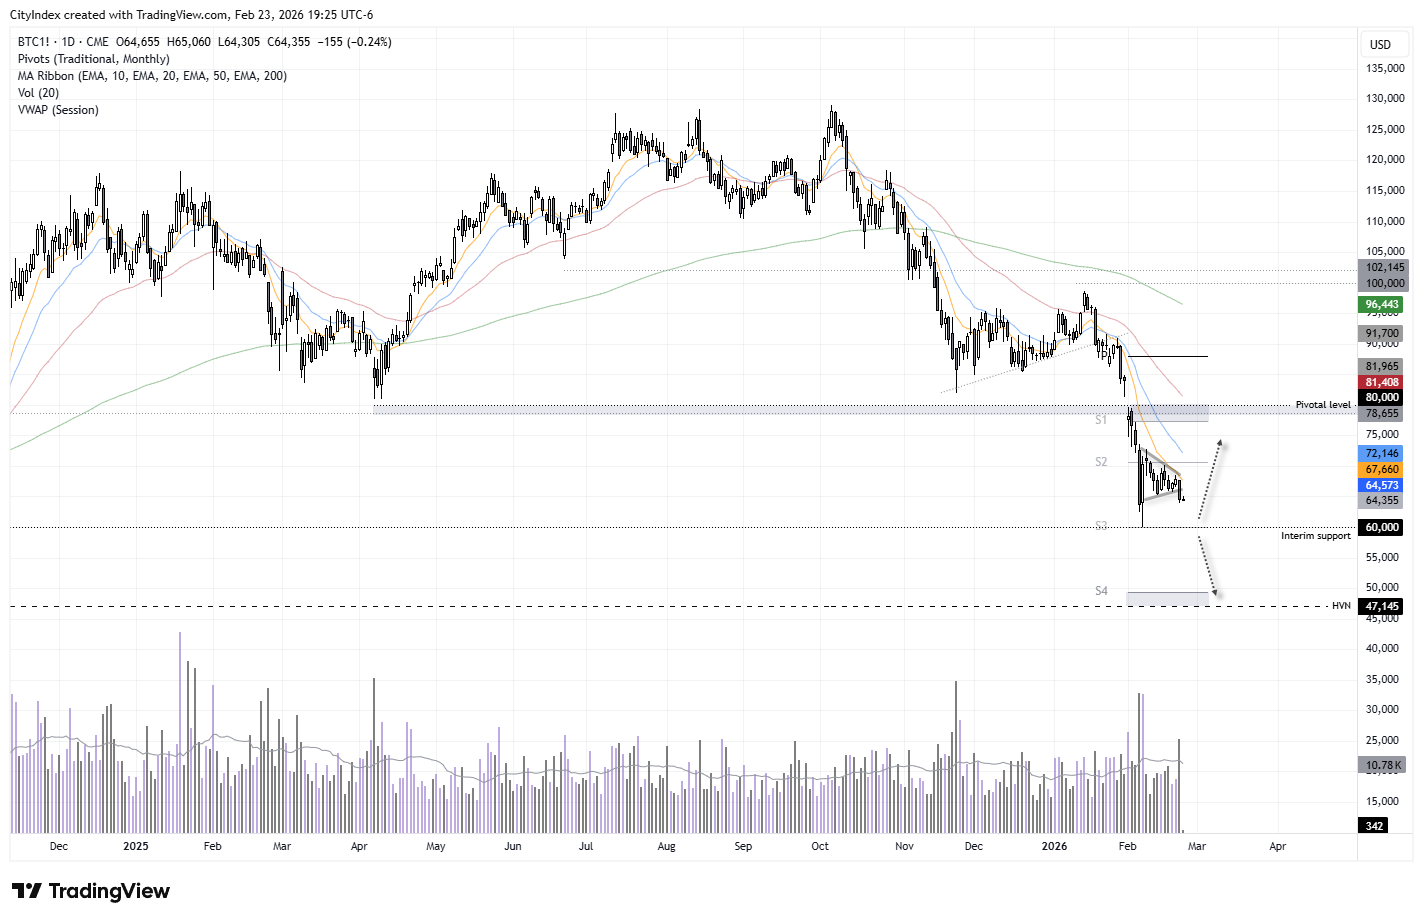
Source: CME, TradingView
View the full economic calendar-- Written by Matt Simpson
Follow Matt on Twitter @cLeverEdge
How to trade with City Index
You can trade with City Index by following these four easy steps:
- Open an account, or log in if you’re already a customer
• Open an account in the UK
• Open an account in Australia
• Open an account in Singapore
- Search for the market you want to trade in our award-winning platform
- Choose your position and size, and your stop and limit levels
- Place the trade


