


Wall Street’s surge in volatility is reverberating through crypto markets, leaving Bitcoin bulls on edge. The S&P 500 endured its most turbulent session since April, while Bitcoin hovered near key support around 108 k. With correlations between Bitcoin, equities, and tech stocks strengthening, traders should watch for clues from Wall Street’s next move. A breakdown in equities could easily tip Bitcoin into a deeper correction.
View related analysis:
- Nasdaq, Crude Oil Plunge Amid Trump-Tariff Revival as Gold Holds Firm
- US Dollar, Yields Lower After Powell Comments, GBP/USD Holds Ground
- Japanese Yen Selloff Losing Steam, AUD/JPY and AUD/USD Bears Resurface
- AUD/USD Q4 Outlook: Bears Target Slower Growth, RBA Cut
Wall Street Volatility Threatens Bitcoin’s Uptrend
Bitcoin (BTC/USD) Futures Technical Analysis: Bitcoin vs US Dollar
The weekly chart shows that bitcoin bulls have enjoyed a strong rally from the November 2022 low to the August 2025 high. Yet the trend has paused for breath, with prices effectively ranging between 109k and 125k. The question now, of course, is whether we’ll see dip buyers emerge and send bitcoin to fresh highs, or if we’ve witnessed the early stages of a deeper pullback. To answer that, we should look at the relationship between bitcoin and Wall Street, alongside price action clues.
The size of the retracement so far is relatively shallow at just -14%, given the retracement from March to August 2024 was -32.5%, and the one seen in April was of similar size. But we have also seen three reversal candles form around my original bull-flag target, while trading volumes have steadily trended lower.
Bulls are likely to seek dips while bitcoin prices remain above the 108,590 low — but a break beneath that key level clearly paves the way for a deeper pullback.
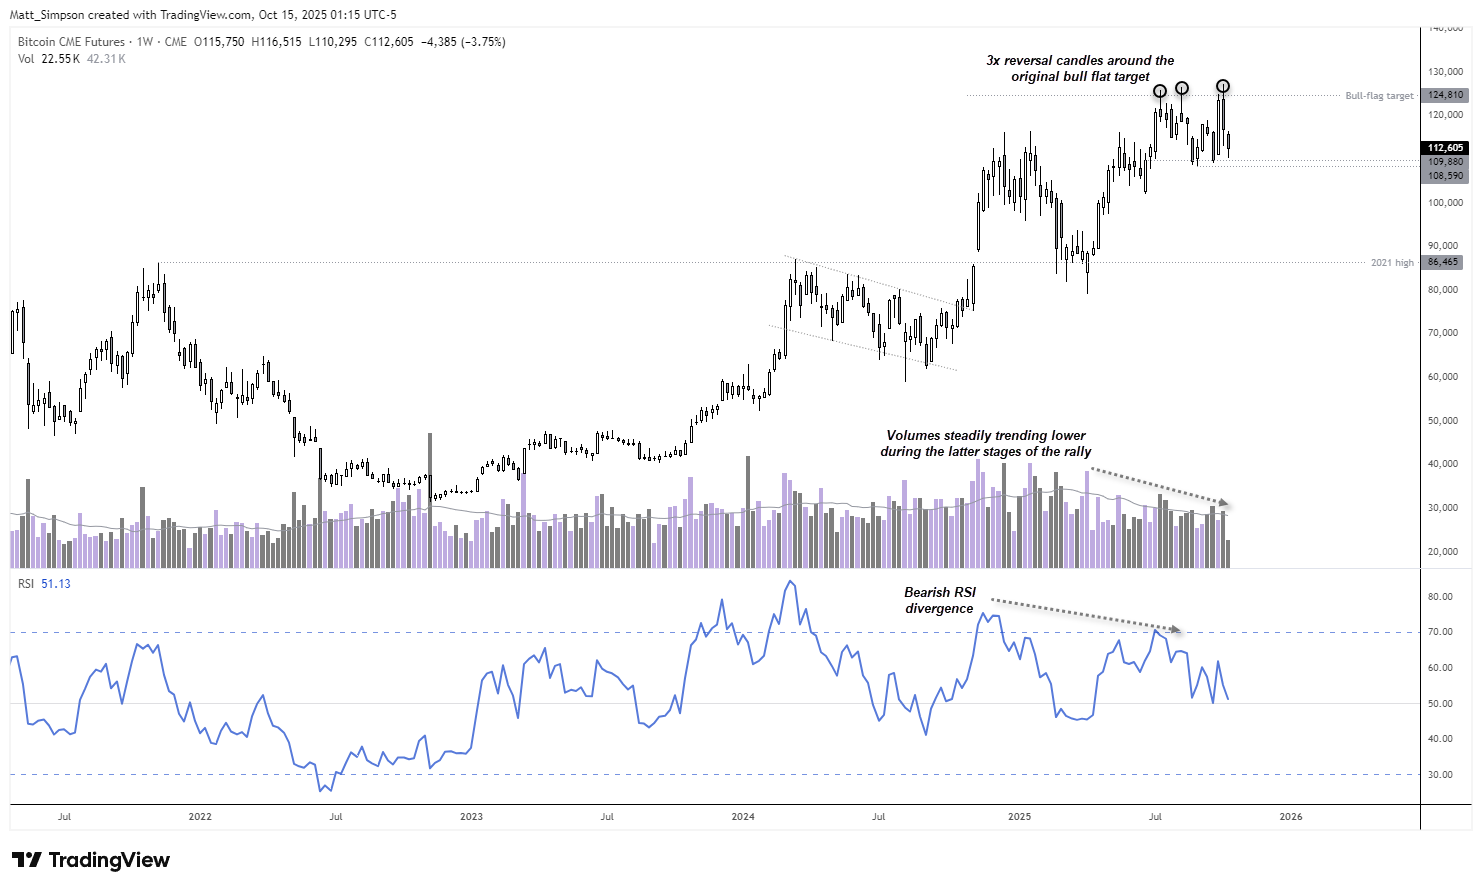
Chart analysis by Matt Simpson - data source: TradingView Bitcoin CME Futures (BTC1!)

Bitcoin (BTC/USD) Technical Analysis: Bitcoin vs US Dollar
Bitcoin has long shared a positive correlation with Wall Street indices, though its strength oscillates over time. Since becoming ‘institutionalised’ before COVID, bitcoin has effectively become another proxy for risk sentiment. I therefore doubt we’ll see the cryptocurrency break to new highs until Wall Street does — unless a sector-specific catalyst emerges.
While correlations are currently strongest between bitcoin, Ethereum, Ripple (XRP), and Solana, these cryptocurrencies typically follow bitcoin’s lead. And with correlations against the Nasdaq 100, S&P 500, and Nvidia’s share price strengthening over the past month, traders should keep a close eye on how these key indices perform. Unfortunately for bitcoin bulls, I suspect we’re witnessing a dead-cat bounce on Wall Street.
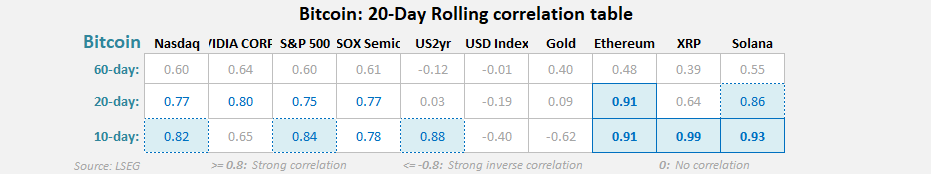
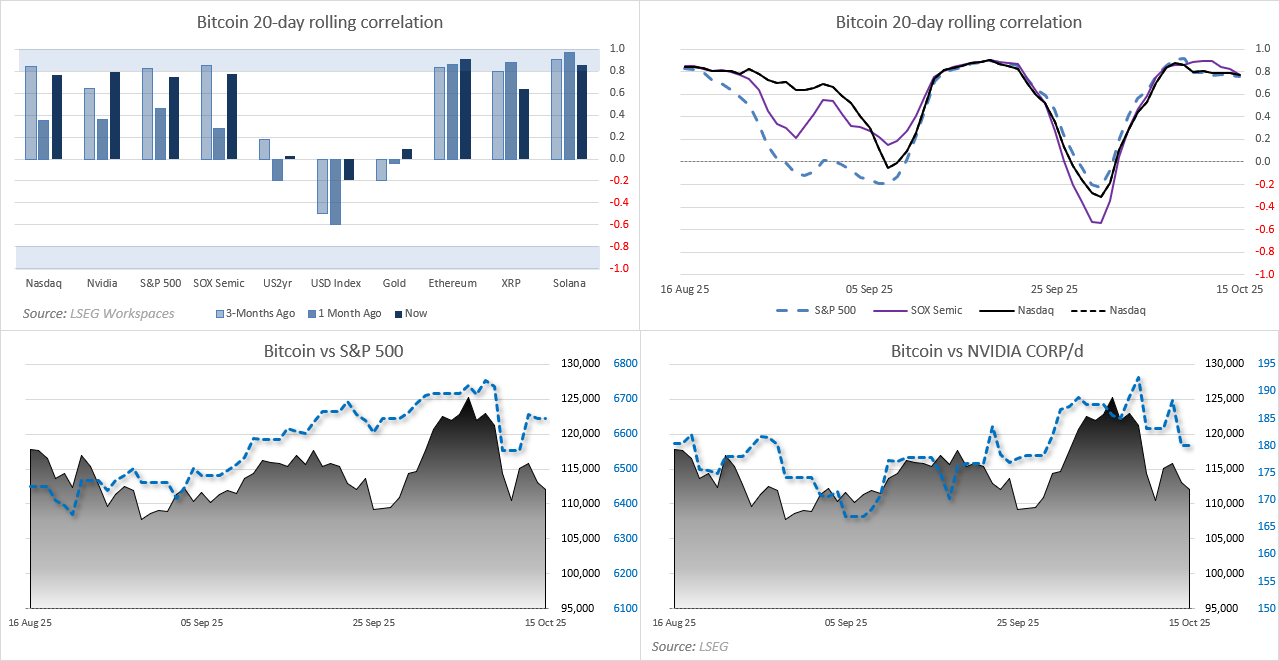
Chart analysis by Matt Simpson - Source: CME, LSEG
S&P 500 Futures (ES) Technical Analysis
Given that Wall Street indices suffered their most volatile session since April on Friday, it’s no surprise to see the S&P 500 meandering within that range. While prices are edging higher, the move appears corrective — suggesting the potential for another leg lower. Also note the bearish divergence on the RSI (14), which warns the S&P 500 could be setting up for a deeper pullback. And although the 50-day EMA held as support, it did so on the first meaningful test of this bullish run. I’m therefore watching for evidence of a swing high on the S&P 500.
The 1-hour chart shows that the largest volume spikes are all bearish. Perhaps S&P 500 bears will find that swing high forming near the 6,741 lows or around the weekly R1 pivot point at 6,758.

Chart analysis by Matt Simpson, Source: TradingView, CME Futures, S&P 500 E-mini Futures

Bitcoin (BTC/USD) Futures Daily Chart:
The daily chart shows a clear momentum shift to the downside from last week’s record high. It almost looks as though the preceding move was a ‘last hurrah’ from bulls, with sentiment now turning against them. The bias is for a break beneath recent swing lows and a move towards the 102k area once a lower high forms on the daily chart.
However, given several nearby support levels and the lower wick on Tuesday’s candle, a short-term bounce may be on the cards. Bulls could seek dips towards the September low and retain a near-term bullish bias while prices remain above 108k, targeting the 120k area.
Bears could either wait for a lower high to form on the daily chart or look for a break below 108k to assume bearish trend continuation.

Chart analysis by Matt Simpson - data source: TradingView Bitcoin CME Futures (BTC1!)
View the full economic calendar
-- Written by Matt Simpson
Follow Matt on Twitter @cLeverEdge
How to trade with City Index
You can trade with City Index by following these four easy steps:
- Open an account, or log in if you’re already a customer
• Open an account in the UK
• Open an account in Australia
• Open an account in Singapore
- Search for the market you want to trade in our award-winning platform
- Choose your position and size, and your stop and limit levels
- Place the trade


