
The British pound has shown resilience against the US dollar but remains vulnerable to renewed yen strength. GBP/USD is consolidating above key support with scope for a rebound, while GBP/JPY faces mounting resistance following an overextended rally. Together, these setups highlight how sterling’s outlook differs across major counterparts.
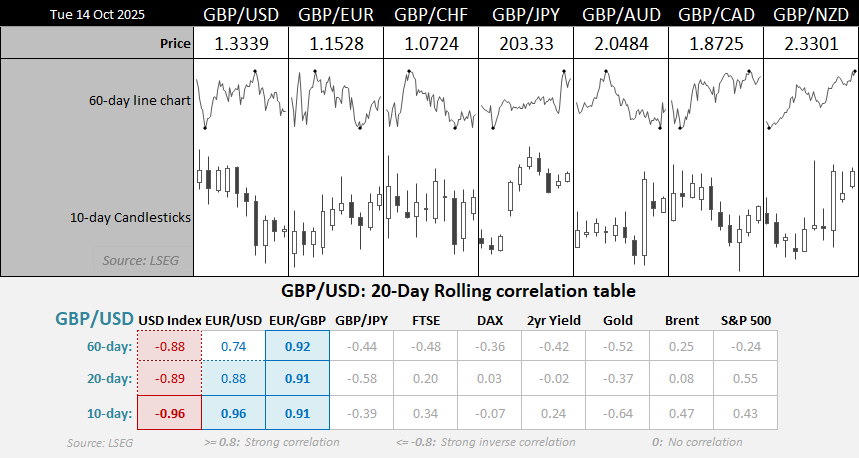
Chart prepared by Matt Simpson - data source: LSEG
View related analysis:
- US Dollar Rebound Appears Corrective, EUR/USD And GBPUSD Set To Bounce?
- Japanese Yen Selloff Losing Steam, AUD/JPY and AUD/USD Bears Resurface
- AUD/USD, USD/JPY: Mild Rebound for Australian Dollar and Yen Faces Resistance
- AUD/USD Q4 Outlook: Bears Target Slower Growth, RBA Cut
GBP/USD and GBP/JPY Technical Setups Highlight Diverging Sterling Trends
GBP/USD Technical Analysis: British Pound vs US Dollar
Last Thursday, I outlined a bias for GBP/USD to bounce over the near term. While cable went on to reach a nine-week low later that day, several nearby support levels place British pound bulls in a better position for a rebound — at least in the short term.
A heavily oversold daily RSI(2) accompanied Thursday’s low, before the subsequent up day found support at the 200-day EMA (1.3267) and the monthly S1 pivot point (1.3269). While a small bearish inside day that followed showed a lack of appetite for GBP/USD to push higher, I suspect any pullback in the pound will remain above Friday’s low for now.
1.3400 seems a viable near-term target for GBP/USD bulls, just beneath the current VPOC (volume point of control) for October. A break above 1.3440 brings 1.3500 into focus, which sits between the monthly pivot point (1.3497) and September’s VPOC (1.3516).
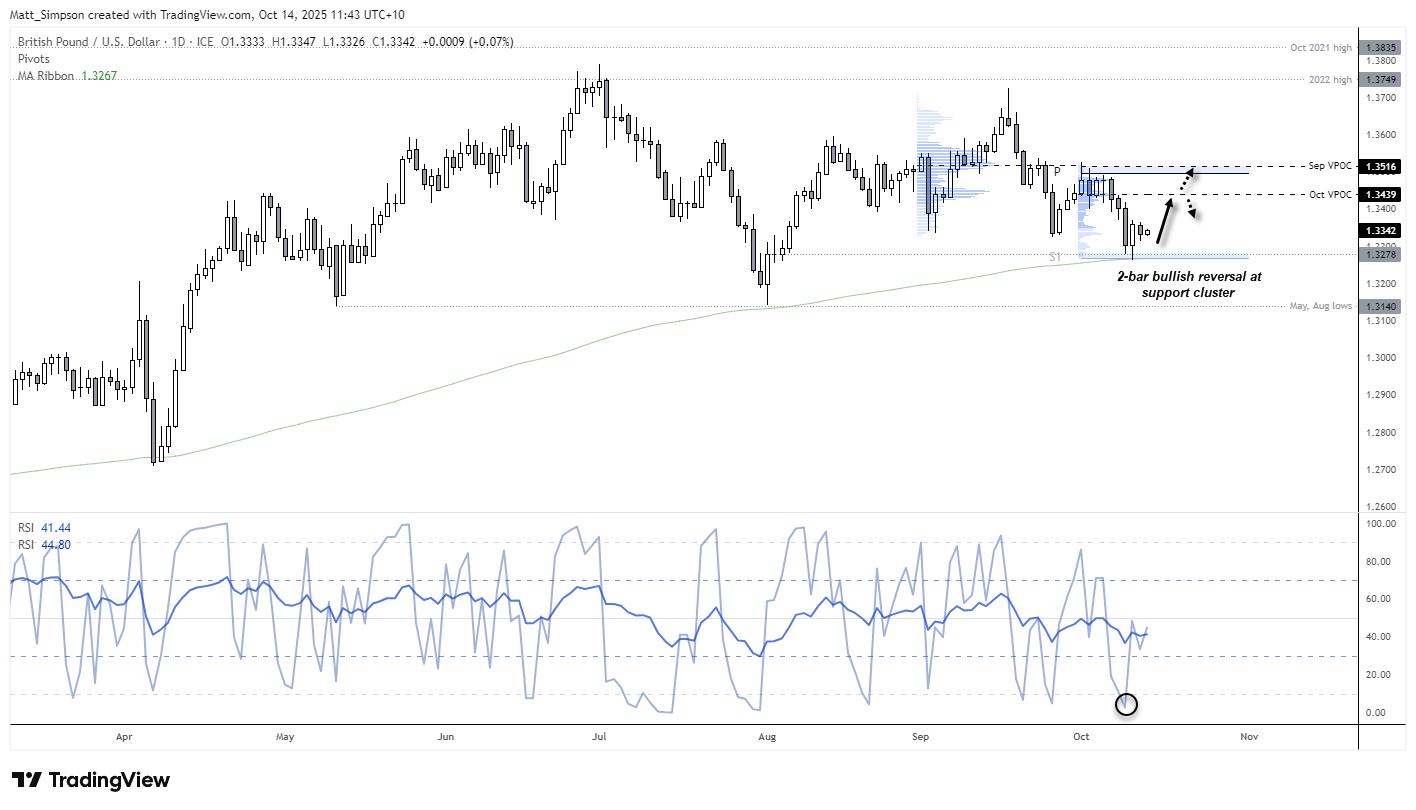
Chart analysis by Matt Simpson - data source: TradingView GBP/USD

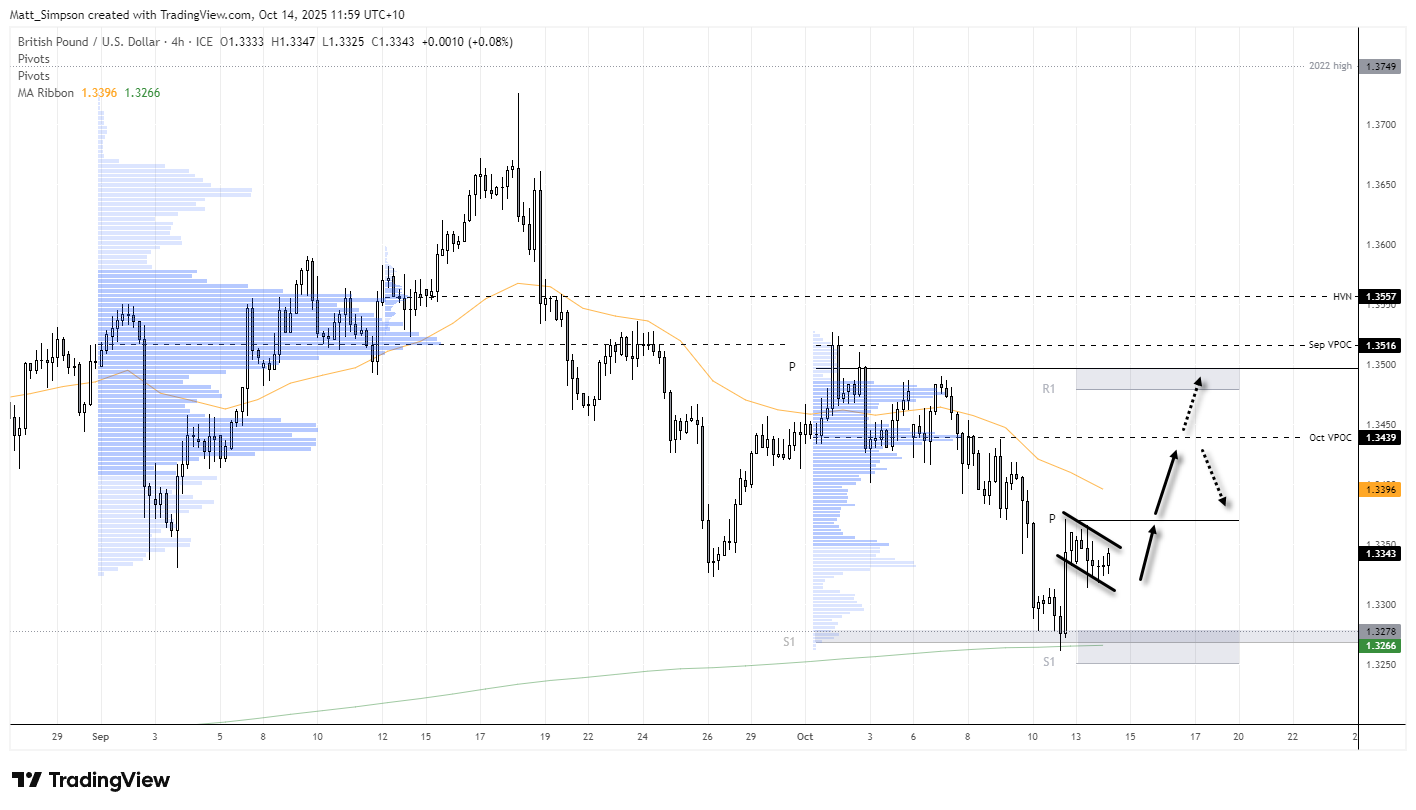
GBP/USD Technical Analysis: 4-Hour Chart
The intraday timeframe of GBP/USD captures the strength of Monday’s rebound from support. And with prices now consolidating, a potential bull flag counter to the prior trend could be in play. It is a shame that the weekly pivot point (1.3370) hovers overhead, but I am anticipating a break above it given the strength of the rebound from several solid levels of support.
GBP/USD bulls could seek dips within Monday’s range in anticipation of a break above the monthly pivot. A break above which brings the October VPOC into focus. Also note that the weekly R1 pivot (1.3480) sits just below the monthly pivot point (1.3497).

GBP/JPY Technical Analysis: British Pound vs Japanese Yen
The British pound finds itself in a very different position against the Japanese yen compared with the US dollar, meaning GBP/JPY is out of phase with USD/JPY. News that a less-hawkish prime minister is set to take the helm in Japan saw a broad sell-off of the yen last week, though renewed risk aversion has since supported the yen and weighed on pairs such as GBP/JPY and USD/JPY.
The daily chart suggests GBP/JPY has likely completed the first wave lower — either as part of a correction or the start of a new trend. This implies that the current two-day rebound is corrective in nature, and momentum could soon turn lower in line with the recent sell-off. I doubt GBP/JPY will swiftly break back below the 200 handle without a fresh catalyst, but that still leaves some wriggle room for bears to press the downside over the near term.

Chart analysis by Matt Simpson - data source: TradingView GBP/JPY
GBP/JPY Technical Analysis: 4-Hour Chart
The intraday chart shows that momentum has turned higher, though the current rally has stalled around the monthly R3 pivot point. The fact that GBP/JPY has already traded above the R4 resistance level — and not even halfway through the month — highlights how overextended the prior rally was.
I’m now looking for signs of a swing high, with the 204 handle, monthly R4, and weekly R1 pivots clustered around 204.50 forming potential resistance zones where momentum could begin to revert lower.
View the full economic calendar
-- Written by Matt Simpson
Follow Matt on Twitter @cLeverEdge
How to trade with City Index
You can trade with City Index by following these four easy steps:
- Open an account, or log in if you’re already a customer
• Open an account in the UK
• Open an account in Australia
• Open an account in Singapore
- Search for the market you want to trade in our award-winning platform
- Choose your position and size, and your stop and limit levels
- Place the trade